P. 2 ~ Continued - Methane in Pennsylvania water wells unrelated to Marcellus shale fracturing

Displaying 2/10
View Article as Single page
Cabot also collected an extensive background set of water samples in an 80 sq mile area in Brooklyn, Harford, and Gibson townships in 2011 for analyses of dissolved gases. In total, these 1,713 measurements (dating from 2008 through 2011) provide a baseline characterization of groundwater conditions prior to proximate oil and gas drilling, hydraulic fracturing, or production activities (Fig. 1).
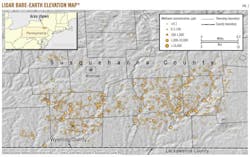
The results of the extensive "predrill" water well sampling and background survey show methane to be nearly ubiquitous in water wells in this region, with over 78% of the water wells exhibiting detectable methane concentrations. In Fig. 1, dissolved methane concentrations have been plotted on a Light Detection And Ranging (LiDAR) bare-earth elevation map.
The spatial distribution of methane concentrations shows a clear relationship with surface topography, with measurably higher dissolved methane concentrations in water wells located in valleys (topographic lows) relative to upland areas.
To support statistical analysis, LiDAR digital elevation models and the USGS National Hydrography Dataset (NHD) have been used to characterize water well locations in valleys (defined as the area within 1,000 ft of a major NHD flowline, i.e., major drainage, and 500 ft of minor tributaries to NHD flowlines) or uplands (greater than 1,000 ft or 500 ft from a major or minor drainage, respectively).
Although only 51% of the sample locations are in the valleys, valley wells represent approximately 88% of the wells containing dissolved methane concentrations in excess of 7,000 ppb (the current methane action level for water wells established by the Pennsylvania DEP). In addition, a Kruskal-Wallis one-way analysis of variances shows a statistically significant difference between methane levels in lowland (841 locations) vs. upland water wells (872 locations) (p-value <0.001).
(While the Kruskal-Wallis test does not require normally distributed populations, equal population variances are assumed. Consequently, a Box-Cox variance-stabilizing transformation, based on Levene's test, was performed on the data set prior to analysis.)
The results of these statistical analyses are supported by testimony from water well drillers in Susquehanna County, who note that water wells with gas shows are most commonly observed in valleys.2
Similar conditions were observed in a study by the US Geological Survey in West Virginia in 1997-2005, where data sampled from 170 water wells found methane concentrations exceeding 10,000 ppb to occur only in wells located in valleys and hillsides, rather than hilltops.3
Susquehanna County has been the focus of extensive natural gas development in recent years, with 303 gas wells drilled from July 2006 to September 2011.4
The water well dissolved methane concentration data presented in our current study were collected "predrill," i.e., prior to nearby drilling activities; consequently a relation of these dissolved methane concentrations to gas production activity would not be expected.
Nevertheless, the data have been evaluated for a possible relation to drilling activity by subdividing the data set of water wells sampled through 2011 into locations in "gas production areas" (conservatively defined as the area within 1 km of gas wells drilled prior to 2011) and locations in "nonproduction areas" (i.e., no gas well drilled prior to 2011 within 1 km).
Based on this comparison, the methane concentrations in water well samples exhibit no relationship to existing gas production activities. Specifically, a Kruskal-Wallis one-way analysis of variance, comparing dissolved methane concentrations at locations within 1 km of the nearest drilled gas well (527 water wells) to concentrations at locations greater than 1 km from the nearest gas well (1,186 water wells), shows no statistically significant difference between these populations (p-value = 0.4).
The records of the Pennsylvania DEP indicate that an additional 84 gas wells were drilled in January-September 2011. As a second conservative check, we have repeated this statistical analysis using all gas well drilling locations through September 2011 (some of which may have been drilled after the water well samples were collected). This analysis was also found to show no statistically significant difference in dissolved methane between production and nonproduction areas (p-value >0.9).
This observation echoes that of a November 2011 study by the Center for Rural Pennsylvania,5 which sampled 48 water wells in Pennsylvania at varying distances (284-2,500 ft) from gas wells both before and after drilling and fracturing activities, and found no significant relationship of methane concentrations to distance from a gas well. The correlation of elevated methane concentrations with topography, rather than oil and gas operations, suggests an origin rooted in the underlying geology of northeastern Pennsylvania.
Displaying 2/10
View Article as Single page