P. 2 ~ Continued - New approach predicts volume mixing in long, multiproduct pipeline
View Article as Single page
Data analysis
Sorting and analyzing 13 batches of SWMPP data made it clear the quality of the data would directly affect final regression results. A small quantity of the field data required combining screening of the data with regression of the contamination formula and deletion of unreasonable data. This article divides SWMPP into 15 sections for regression.
When the data-quality's effect on regression results is being reduced to make them meet characteristics of the products pipeline, the actual mixing volume of the previous pipeline segment, the flow rate, and the downloaded contaminated product volume of the current pipeline segment all help calculate the mixing volume of each pipeline segment. This method not only makes full use of the field data, but also avoids data discrepancies among the sections. If no data are available for one pipeline segment, this method also leaves subsequent contamination calculations unaffected.
Comparing all batches of contamination data within the same segment precedes deleting any unreasonable data and automatic acquisition of the segment's regression coefficient of contamination calculation.
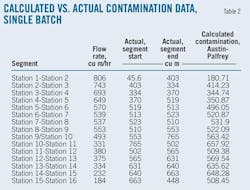
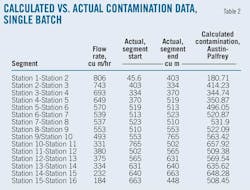
Table 2 shows an example of one batch of contamination data, including the comparison between the Austin formula calculation value and the field contamination data.
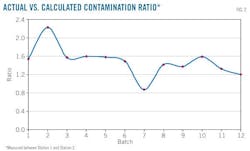
The regression coefficient is the ratio of the actual mixing volume with calculation contamination data derived by the Austin formula, in this case, using one pipeline segment. Fig. 2 identifies ratios of all the batches in the Station 1-Station 2 segment. This calculation removes extreme values to give a more realistic working average by which to acquire the average Station 1-Station 2 ratio of 1.496 actual vs. calculated contamination.
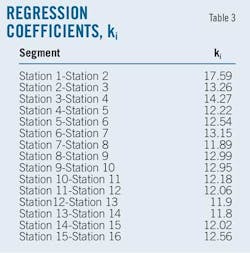
Table 3 shows the corresponding average ratio of each pipeline segment.
Data validation
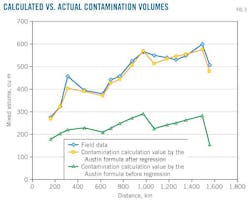
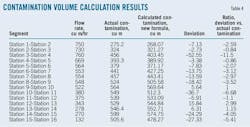
The coefficients in Table 3 provide validation results for the contamination data in Fig. 3 and Table 4, which show the calculated contamination value as being close to the actual data and demonstrate the new formula's usability for practical application. This formula is effective in that it not only includes the influence of variable pipe diameter and variable flow rate, but also accounts for initial mixing volume, contamination produced in its pumping stations, and contamination caused by terrain.
