New approach predicts volume mixing in long, multiproduct pipeline
Liang Yongtu
China University of Petroleum
Beijing
Xiaolei Guo
Oil and Gas Pipeline Control Center
Beijing
Combining the classical Austin-Palfrey formula with field data creates a new formula capable of predicting the amount of mixed-product volume arriving at each terminal of a long, multiproduct pipeline crossing varied terrain.
The new formula considers the structure and terrain of the pipeline, the characteristics of the mixed oil products in its pumping stations, and the distribution of the products along its length.
Background
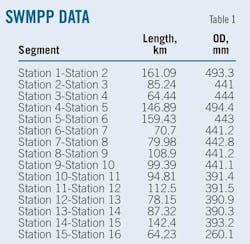
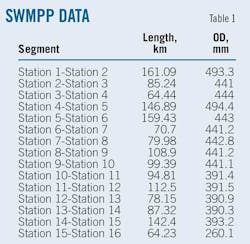
The 1,691-km trunkline of China's Southwest Multi-Product Pipeline (SWMPP) has 16 pump stations. The topography of the first half is gentle, while subsequent sections become rugged. OD along the trunkline varies in correspondence with design throughput as it changes along different sections of the pipeline.1 Table 1 shows the different diameters along the pipeline from the initial station to the final terminal.
The operation cost of batch transportation on the multiproduct pipeline increases in accordance with contamination, which is unavoidable at the interface between different batches. A relatively precise estimation of mixing volume, the amount of product that has become cross-contaminated, influences its disposition in the terminal station.
The Austin-Palfrey formula can only be applied to a horizontal pipe having the same OD for its entire length, considering flow characteristics and growth rules of mixed oil products.2 It became necessary, therefore, to find useful information from the field data to obtain a contamination product formula for the SWMPP.
This article establishes a new formula that includes such influential factors as terrain and structure of the pipeline, initial mixing volume, variation of throughput, changes in OD, characteristics of mixed oil products in its pumping stations, and distribution of products along its length.
SWMPP is divided into 15 sections. Applying the Austin-Palfrey formula to each of the 15 sections yields a relatively precise mixing volume calculation for the terminal station.
Contamination formula
Field data show each pipeline segment operating under conditions such that the Reynolds number is larger than the critical Reynolds number, requiring introduction of a coefficient to the Austin formula suitable to the SWMPP in the smooth area.
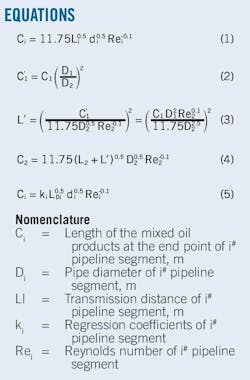
Equation 1 shows the Austin-Palfrey formula to be used when the Reynolds number is larger than the critical Reynolds number.
SWMPP has several subtransmission points, causing the flow rate to vary along the pipeline. OD of different segments varies according to the designed flow rate. Using the change point of flow rate or the diameter change point allows division of the pipeline into segments.
Instead of changing the diameter and flow rate of each pipeline segment, this article uses the equivalent tube-length method.3 An example illustrates this method using a two-segment pipeline (Fig. 1). The length and OD measure L1 and D1, respectively. Flow rate = Q1, Reynolds number = Re1, and length of contamination = C1. The converted length and OD are L2 and D2. The flow rate is Q2 and Reynolds number Re2.
When Reynolds number exceeds the critical Reynolds number, using the equivalent tube-length method and the Austin-Palfrey formula, Equations 2-4 calculate the length of contamination at the end point of segment C2.
Though volumes of initially contaminated product and midway downloaded contaminated product are small, they still affect calculation of the mixing volume at the end point of each segment. Initial contaminated product is introduced at the initial station. Converting the initial contaminated product volume into equivalent tube length precedes adding it to the length of the first pipeline segment.
SWMPP has 12 subtransmission points. Each subtransmission point is likely to download contaminated product. Subtracting midway downloaded mixed oil product is subtracted from the mixed oil products that arrive at the end point precedes converting the remaining mixed oil products volume into equivalent tube length and adding this equivalent tube length to the length of the pipe segment.
The volume of cross-mixed products caused by pumping stations varies for every pipeline and is treated as a constant here to simplify calculation. Doing so does not affect results of the contaminated product formula regression.
Analysis and calculation yield Equation 5, a modified contamination formula with the form of Austin-Palfrey formula under the condition that the Reynolds number is larger than the critical Reynolds number.
Regression analysis of SWMPP's field data provides the coefficient of every section and contamination calculation formulae meeting the characteristics of the products pipeline.
Data analysis
Sorting and analyzing 13 batches of SWMPP data made it clear the quality of the data would directly affect final regression results. A small quantity of the field data required combining screening of the data with regression of the contamination formula and deletion of unreasonable data. This article divides SWMPP into 15 sections for regression.
When the data-quality's effect on regression results is being reduced to make them meet characteristics of the products pipeline, the actual mixing volume of the previous pipeline segment, the flow rate, and the downloaded contaminated product volume of the current pipeline segment all help calculate the mixing volume of each pipeline segment. This method not only makes full use of the field data, but also avoids data discrepancies among the sections. If no data are available for one pipeline segment, this method also leaves subsequent contamination calculations unaffected.
Comparing all batches of contamination data within the same segment precedes deleting any unreasonable data and automatic acquisition of the segment's regression coefficient of contamination calculation.
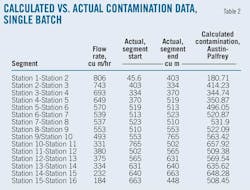
Table 2 shows an example of one batch of contamination data, including the comparison between the Austin formula calculation value and the field contamination data.
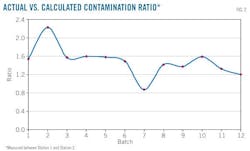
The regression coefficient is the ratio of the actual mixing volume with calculation contamination data derived by the Austin formula, in this case, using one pipeline segment. Fig. 2 identifies ratios of all the batches in the Station 1-Station 2 segment. This calculation removes extreme values to give a more realistic working average by which to acquire the average Station 1-Station 2 ratio of 1.496 actual vs. calculated contamination.
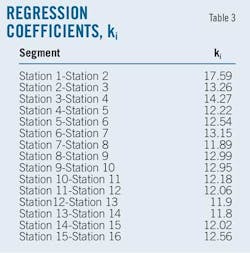
Table 3 shows the corresponding average ratio of each pipeline segment.
Data validation
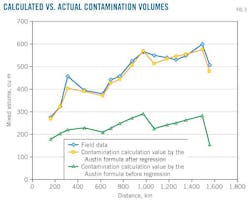
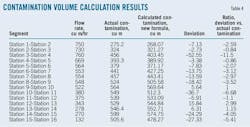
The coefficients in Table 3 provide validation results for the contamination data in Fig. 3 and Table 4, which show the calculated contamination value as being close to the actual data and demonstrate the new formula's usability for practical application. This formula is effective in that it not only includes the influence of variable pipe diameter and variable flow rate, but also accounts for initial mixing volume, contamination produced in its pumping stations, and contamination caused by terrain.
Terrain effects
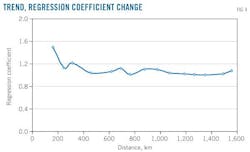
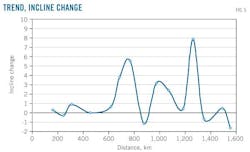
Verifying the initial assumption that the terrain and structure of the pipeline should be recognized as factors requires calculating the relationship between the regression coefficient and the incline of each pipeline segment. Figs. 4 and 5 show the regression coefficients and the inclines, respectively.
The change in the regression coefficients is consistent with that of pipeline incline in the first half of the pipeline, but the regression coefficients in the second half scarcely change.
Terrain has a smaller effect on mixing volume as it travels along the pipe. At the beginning of transportation the mixing volume is proportionally larger. The axial concentration gradient becomes flatter, however, and the diffusion coefficient smaller as the mixing zone is transported along the pipeline.4
Researchers have already proven that when the Reynolds number is larger than the critical Reynolds number, the influence of incline upon the mixing volume calculation can be ignored.5 Their conclusion does not contradict this article.
Though the change in the regression coefficient is consistent with that of incline, it does not prove disproportionate under this condition, making the influence of topography on mixing volume calculation minimal. This influence should, however, be considered when calculating the mixed oil products volume of a variable-diameter products pipeline to improve accuracy in predicting the mixing volume expected to arrive at the terminal station.
Application
According to the results of the developed batch-schedule software, including average flow and distribution of the mixing volume along the pipeline, the new formula allows prediction of product mixing.
This computing method is suited to any pipeline having a variable diameter under all kinds of operating conditions, as shown in the following examples (assuming known average flow and initial contamination for each section).
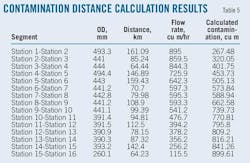
Table 5 shows in the calculation results of contaminated volumes reaching each station based on an initial mixed volume of 45 cu m and no mixed oil being introduced along the pipeline.
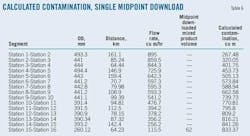
Table 6 shows the calculation results of contaminated volumes reaching each station based on an initial mixed volume is 45 cu m, a downloaded mixed volume in Segment 15-16 of 62 cu m, and no mixed oil product downloaded in the other stations.
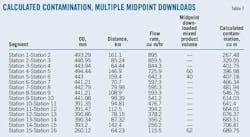
Table 7 shows the calculation results of contaminated volumes reaching each station based on an initial mixed volume 45 cu m, downloaded mixed volumes in Segment 4-5 of 60 cu m, in the Segment 5-6 of 40 cu m, and in Segment 15-16 of 62 cu m. No additional mixed oil product downloading occurs at the other stations.
The calculations in Tables 5, 6, and 7 show that the higher the volume of mixed oil products downloaded at each station, the smaller the mixed volume that arrives at the terminal station under the same flow conditions.
References
1. Dai, F., and Hu, X., "The Contamination calculation Formula for the Southwest Multi-product Pipeline," Oil & Gas Storage and Transportation, Vol. 28 (2009), No. 2, pp. 40-42.
2. Deng, S., and Pu, J., "The comparison between 1-d model and two-dimensional model of the multi-product pipeline," Oil & Gas Storage and Transportation, Vol. 16 (1997), No. 1, pp. 16-18.
3. Chen, Q., "Calculations on the Mixing Volume of Products Pipeline with Variable Diameter Pipes," Oil & Gas Storage and Transportation, Vol. 18 (1999), No. 1, pp. 7-8.
4. Yang, X., and Zhang, G., "Design and Management of Oil Products Pipeline," Beijng: China University of Petroleum Press, 2005.
5. Kang, Z., and Gong, J., "The Study on the Contamination of Products Pipeline," Oil & Gas Storage and Transportation, Vol. 21 (2002), No. 5, pp. 1-4.
The authors
More Oil & Gas Journal Current Issue Articles
More Oil & Gas Journal Archives Issue Articles
View Oil and Gas Articles on PennEnergy.com
