Falling oil prices will disrupt feed cost differentials
Dan Lippe
Petral Consulting Co.
Houston
Collapsing crude oil prices in fourth-quarter 2014 resulted in major changes in US production cost differentials between ethane and all other feedstocks. Feedstock flexibility will yield large dividends in first-half 2015.
US ethylene producers are recognized worldwide for their feedstock flexibility and their ability to adjust, within a few days or weeks, to changes in cost relationships between feedstocks.
Since the late 1970s, US ethylene producers consistently invested capital to increase operational flexibility and invested time to develop the management expertise required to exercise operational flexibility. Historically, these investments paid dividends by enabling ethylene producers to take advantage of short-term aberrations (a few weeks or a few months) in production cost relationships among feedstocks.
More importantly, investments in feedstock flexibility occasionally paid substantial dividends when crude oil prices surged or collapsed and wide variations in production cost differentials among feedstocks emerged and persisted for months or even years.
One simple comparison underscores the value of feedstock flexibility. Total US ethylene production in second-half 2014 was only 0.5% more than in first-half 2014. Propane and normal butane, however, emerged as low-cost feedstocks in fourth-quarter 2014, and production from propane and normal butane in second-half 2014 was 10% more than in first-half 2014.
The shift in ethylene production costs for major feedstocks was the most important influence on ethylene and propylene markets during second-half 2014 and will remain the most important influence during first-half 2015.
Ethylene economics, pricing
Ordinarily, this article series begins with a review and discussion of trends in ethylene feed slates and olefins production. Due to the collapse in crude oil prices during fourth-quarter 2014, however, this article begins with a review of the decline in crude oil prices and the impact on ethylene production costs for industry's major feedstocks.
Variations in crude oil prices are generally the most important economic influence on prices for most ethylene feedstocks and sometimes all feedstocks. All ethylene feedstock prices available to flex-feed plants in the US Gulf Coast are directly influenced by crude oil prices. The extensive feedstock flexibility that exists in flex-feed ethylene plants creates this economic linkage between feedstock and crude oil prices. Flex-feed plants are those plants that have the demonstrated capability to use ethane, propane, normal butane, natural gasoline, refinery naphtha, and gas oil.
Ethylene production costs
The collapse in crude oil prices during fourth-quarter 2014 affected spot prices (and ethylene production costs) for most feedstocks but had little effect on ethane prices. The important benchmarks for crude oil prices include West Texas Intermediate (WTI), dated Brent, and the Organization of Petroleum Exporting Countries' Reference Basket (ORB).
WTI is a domestic crude oil (all WTI and most US crude oil production of similar quality) and is available only to US refineries. Dated Brent is the primary benchmark crude oil available to refineries in northwest Europe, and ORB prices are calculated by formulas based on daily spot prices for a basket of crude oil available from various member countries of OPEC.
The collapse in crude oil prices during fourth-quarter 2014 began in July. Prices for all three major pricing benchmarks declined 2-6%/month in July, August, and September, and 10-12%/month in October and November.
Saudi Arabia's Minister of Energy made an official policy statement in early October to the effect that the business of the kingdom is to produce and sell oil and refined products. The business of the market is to determine the price. This official statement accelerated the rate of decline compared with the rates of decline in third-quarter 2014.
Finally, OPEC convened an official meeting in late November but recessed without any serious discussion of a production quota agreement (OGJ Online, Dec. 1, 2014). The crude oil market correctly interpreted these two events as very bearish pricing signals. The rate of decline for crude oil prices accelerated to 20-22%/month in December.
Since the Texas Railroad Commission in August 1930 initiated a regulatory program to control crude oil production and pricing by prorationing, world crude oil supply and demand and pricing have been managed and controlled, sometimes well and sometimes poorly. In October 2014, world crude oil markets moved into uncharted territory.
The decline in crude oil prices immediately affected nearly all feedstock prices including gas oil, naphtha, propane, and normal butane. Based on Gulf Coast spot prices, natural gasoline fell 44%, "non-TET" normal butane prices declined 41% and propane prices declined 32%. Ethane prices, however, declined by only 25%. ("TET" is short for "Texas Eastern" and refers to petroleum products in Texas Eastern storage at Mont Belvieu, Tex., now owned and operated by Lone Star Partners, an operating unit of Energy Transfer Partners. "Non-TET" refers to product at Mont Belvieu but in other owners' facilities.)
Furthermore, as was true in previous crude oil price collapses (1986, 1998), prices for propylene and butadiene declined more slowly compared with feedstock prices. The lag in propylene and butadiene prices limited the decline in coproduct credits and thereby pushed ethylene production costs even lower for all feedstocks except ethane.
Based on valuation of all coproducts at spot prices, ethylene production costs based on purity-ethane feeds were 9-12¢/lb in third and fourth quarters 2014. Production costs based on ethane for third-quarter 2014 were 2.5¢/lb less than in second-quarter 2014 but were only 0.6¢/lb lower than year-earlier costs.
In third-quarter 2014, purity ethane provided ethylene producers with a cost savings of 31¢/lb vs. natural gasoline. The cost advantage for ethane vs. natural gasoline in third-quarter 2014 was 2¢/lb more than in third-quarter 2013 but 7¢/lb less than in second-quarter 2014. In third-quarter 2014, purity ethane also provided a cost savings of 9¢/lb vs. propane compared with 8.6¢/lb in second-quarter 2014. Ethane's cost advantage vs. propane, however, was almost 10¢/lb less than in third-quarter 2013.
In fourth-quarter 2014, purity ethane's cost advantage vs. natural gasoline was only 14¢/lb vs. 33.5¢/lb in fourth-quarter 2013 and 31.4¢/lb in third-quarter 2014. Purity ethane's cost advantage compared with propane was less than 1¢/lb in fourth-quarter 2014. In December 2014, however, ethylene production costs based on purity ethane were 4¢/lb more than for propane. Within a period of only 60 days, ethane's cost advantage vs. propane eroded from 10¢/lb to zero.
Production costs for purity propane were 20¢/lb in third-quarter 2014 and fell to 11¢/lb in fourth-quarter 2014. During fourth-quarter 2014, production costs for propane fell to 5¢/lb in December from 16¢/lb in October. Production costs for purity propane were only 2¢/lb less than in third-quarter 2013 but were 20¢/lb less than in fourth-quarter 2013. In third-quarter 2014, production costs for propane were 22¢/lb less than for natural gasoline, but propane's cost advantage narrowed to 13¢/lb in fourth-quarter 2014.
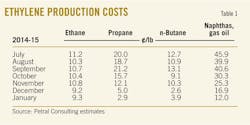
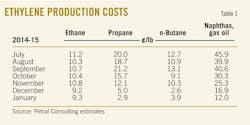
Production costs for natural gasoline were 42¢/lb in third-quarter 2014 and fell to 24¢/lb in fourth-quarter 2014. Production costs for natural gasoline in third-quarter 2014 were 6¢/lb less than in third-quarter 2013 and 21¢/lb less than in fourth-quarter 2013 (Table 1).
Ethylene pricing, profit margins
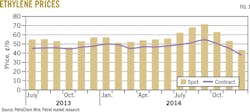
PetroChem Wire daily reports (www.petrochemwire.com) showed spot prices for ethylene in the Williams Hub averaged 67¢/lb in third-quarter 2014 and peaked at 72¢/lb in September. Spot prices fell steadily in fourth-quarter 2014 and were 43¢/lb in December or 29¢/lb less than in September.
The contract benchmark inched higher in third-quarter 2014 and was 52¢/lb. Consistent with the peak in spot prices in September, major producers and consumers agreed to increase the net transaction price to 54.5¢/lb in September. Spot prices maintained premiums of 12-18¢/lb vs. net transaction pricing (NTP) in third-quarter 2014.
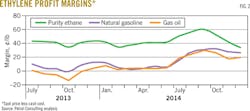
In fourth-quarter 2014, ethylene's NTP for December 2014 fell to 38.25¢/lb and was 16.25¢/lb (29.8%) less than in September. Margins in December based on the NTP were 29-36¢/lb for ethane, propane, and normal butane; 21¢/lb for natural gasoline; and 15¢/lb for gas oil. In contrast, margins in second-quarter 2014 were 2-4¢/lb below breakeven for natural gasoline and gas oil.
Fig. 1 shows historic trends in ethylene prices (spot prices and NTP). Fig. 2 shows profit margins based on spot ethylene prices and variable production costs.
Olefin-plant feed slate trends
Petral Consulting Co.'s monthly survey of plant operating rates and feed slates showed ethylene industry demand for fresh feed was 1.61 million b/d in third-quarter 2014 and 1.62 million b/d in fourth-quarter 2014. Demand for fresh feed in third-quarter 2014 was 70,900 b/d (4.2%) less than in third-quarter 2013 and 49,400 b/d (3.0%) less than in fourth-quarter 2013.
The decline in demand for fresh feed was consistent with reductions in ethylene production in third and fourth quarters 2014 vs. second-half 2013.
Survey results showed demand for NGL feeds (ethane, propane, and normal butane) was 1.45 million b/d in third-quarter 2014 and 1.46 million b/d in fourth-quarter 2014. Demand for NGL feed in third-quarter 2014 was 55,100 b/d (3.7%) less than in third-quarter 2013 and 47,200 b/d (3.1%) less than in fourth-quarter 2013. Finally, NGL feeds accounted for 90-91% of fresh feed in third and fourth quarters 2014.
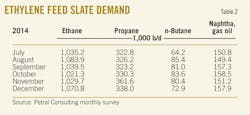
Economics for NGL feeds remained consistently favorable vs. heavy feeds during second-half 2014. Ethylene producers made no major reduction in their use of heavy feeds during second-half 2014. Instead, some ethylene producers adjusted the mix of NGL feeds.
Ethane's share of total fresh feed was 65.6% in third-quarter 2014 and 64.3% in fourth-quarter 2014 vs. 66% in first-half 2014. Propane and normal butane accounted for 25% of total fresh feed in third-quarter 2014 and 26% in fourth-quarter 2014 vs. 23.7% of total fresh feed in first-half 2014.
Ethylene producers had few economic incentives to adjust the mix of NGL feeds (increasing propane or normal butane and reducing ethane) until November. Propane and normal butane accounted for 36.2% of fresh feed in October-November 2014 vs. 34.2% in third-quarter 2014 (Table 2).
Petral Consulting forecasts US ethylene plants will operate at 88-90% of nameplate capacity during first-half 2015 and demand for fresh feed will average 1.70-1.75 million b/d. NGL feeds will account for 90-91% of fresh feed and demand for NGL feeds will increase to 1.50-1.55 million b/d. Furthermore, some ethylene producers will continue to use their feedstock flexibility further to increase propane and normal butane demand vs. ethane.
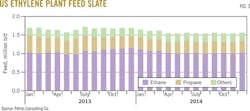
Fig. 3 shows historical trends in ethylene feed.
Ethylene production
Results of the monthly survey showed averages of 147.5 million lb/day in third-quarter 2014 and 148.2 million lb/day in fourth-quarter 2014. Ethylene production in third-quarter 2014 was 544 million lb (3.9%) less than in third-quarter 2013; production in fourth-quarter 2014 was 508 million lb (3.6%) less than in fourth-quarter 2013.
The year-on-year decline in ethylene production in second-half 2014 was not surprising when we compare production losses for the two periods. Specifically, in second-half 2013, ethylene producers had no downtime due to planned turnarounds and minimum production losses due to unplanned maintenance problems.
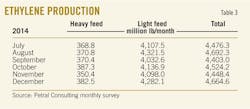
Based on its monthly survey results, Petral Consulting estimates production from light feeds averaged 135.5 million lb/day in third-quarter 2014 and 136.0 million lb/day in fourth-quarter 2014. Production from light feeds in third-quarter 2014 was 418 million lb (3.2%) less than in third-quarter 2013. Production for fourth-quarter 2014 was 457 million lb (3.5%) less than in fourth-quarter 2014.
Ethylene production from heavy feeds averaged 12.1 million lb/day in third-quarter 2014 and 12.2 million lb/day in fourth-quarter 2014. Production from heavy feeds in third-quarter 2014 was 126 million lb (10.2%) less than during third-quarter 2013. Production from heavy feeds in fourth-quarter 2014 was 51 million lb (4.4%) less than in fourth-quarter 2013.
In third-quarter 2014, three ethylene plants were out of service for scheduled turnarounds in July, but there were no turnarounds in August. In September, two plants were out of service for scheduled turnarounds. Petral Consulting estimates production losses due to turnarounds were about 350 million lb.
In addition, a few plants experienced downtime for unplanned maintenance in third-quarter 2014 and production losses were 191 million lb. Total production losses were about 540 million lb in third-quarter 2014.
In fourth-quarter 2014, scheduled turnarounds reduced production for two plants in October, three plants in November, and two plants in December. However, the two plants that were out of service due to fire damage (Geismar in June 2013 and ConocoPhillips Chemical Co. LLC at Port Arthur in July 2014) resumed operating in December. Petral Consulting estimates production losses due to scheduled turnarounds and unplanned maintenance were about 500 million lb in fourth-quarter 2014 (Table 3).
Heavy feeds accounted for 8-9% total ethylene production in 2013, but share of production slipped to 8.0-8.5% in second-half 2014. Most likely, production from heavy feeds will account for 8-9% of total ethylene production in first-half 2015.
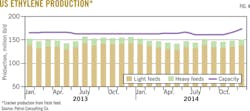
Fig. 4 shows trends in ethylene production.
US propylene production
Coproduct propylene supply depends primarily on the use of propane, normal butane, naphtha, and gas oil. The monthly survey indicates demand in third-quarter 2014 was 324,100 b/d for propane, 76,800 b/d for normal butane, and 152,200 b/d for heavy feeds. In fourth-quarter 2014, demand for propane was 343,300 b/d, demand for normal butane was 79,000 b/d, and demand for heavy feeds was 155,800 b/d.
Total demand for feeds with high propylene yield was 553,400 b/d in third-quarter 2014 and was 55,300 b/d (9.1%) less than in third-quarter 2013. Total demand for these feeds in fourth-quarter 2014 was 578,100 b/d and was 34,100 b/d (6.3%) more than in fourth-quarter 2013. As economic incentives for propane and normal butane compared with ethane improved during fourth-quarter 2014, ethylene producers maintained steady demand for heavy feeds and increased demand for propane.
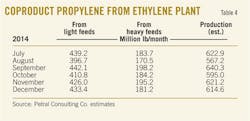
Petral Consulting estimates coproduct supply increased in third quarter and fourth quarters 2014 vs. first-half 2014 due to increased demand for propane and steady demand for normal butane and heavy feeds, but coproduct supply remained less than in 2013. Production was 20.8 million lb/day (1.91 billion lb) in third-quarter 2014 and increased to 21.4 million lb/day (1.97 billion lb) in fourth-quarter 2014. Coproduct supply (from all feedstocks) in second-half 2014 was 173 million lb (4.7%) more than in first-half 2014.
Coproduct supply for third-quarter 2014 was 169 million lb (13.8%) less than in third-quarter 2013. Coproduct supply for fourth-quarter 2013 was 81 million lb (6.7%) more than in fourth-quarter 2013.
Propylene production from light feeds averaged 15.1 million lb/day in third-quarter 2014 and 15.7 million lb/day in fourth-quarter 2014. Production in second-half 2014 was 229 million lb (8.8%) more than in first-half 2014. Production from light feeds in third-quarter 2014 was 98 million lb (6.6%) less than in third-quarter 2013. Production from light feeds in fourth-quarter 2014 was 98 million lb (7.3%) more than in fourth-quarter 2013.
The key factor for the increase in coproduct supply in fourth-quarter 2014 was the increase in demand for propane compared with demand the previous year. Demand for propane in third-quarter 2014 was 14,300 b/d (4.3%) more than in fourth-quarter 2013.
Finally, in third-quarter 2014, coproduct supply from light feeds accounted for 72.6% of coproduct supply and about 28% of US propylene production. In fourth-quarter 2014, coproduct supply from light feeds accounted for 73.1% of coproduct supply and 29% of US propylene production (Table 4).
PDH plant, refineries
According to PetroChem Wire, the propane dehydrogenation plant in the Houston Ship Channel had downtime for maintenance in third quarter and fourth quarters 2014. Downtime in third-quarter 2014 was less than in second-quarter 2014, but downtime in fourth-quarter 2014 was more than second and third quarters combined.
The PDH plant produced an estimated 3.5-3.6 million lb/day in third-quarter 2014, and estimated production loss was 15 million lb in August. Production fell to 2.85-2.95 million lb/day in fourth-quarter 2014, and estimated production losses were 85-90 million lb.
Production in second-half 2014 was equal to production in second-half 2013.
Refinery propylene sales into the merchant market are a function of:
• Fluid catalytic cracking units (FCCUs) feed rates (most important variable).
• FCCU operating severity (important but not directly measurable).
• Economic incentive to sell propylene rather use it as alkylate feed.
Variations in FCCU feed rates are the most important parameter; economic factors are generally of secondary importance.
Statistics from the US Energy Information Administration (EIA) indicate US refineries operated FCCUs at 5.0 million b/d in third-quarter 2014 and an estimated 4.8 million b/d in fourth-quarter 2014. Feed rates for all FCCUs in third-quarter 2014 were 72,000 b/d (1.4%) less than in third-quarter 2013. Feed rates in fourth-quarter 2014 were 49,300 b/d (1.0%) more than in fourth-quarter 2013.
More important for propylene supply in the Gulf Coast petrochemical markets, feed rates for FCCUs in the Gulf Coast and Midcontinent were 3.65 million b/d in third-quarter 2014 and were 100,300 b/d (2.7%) less than in third-quarter 2013. Feed rates for these FCCUs were 3.50-3.55 million b/d in fourth-quarter 2014 and were 85,800 b/d (2.4%) less than in fourth-quarter 2013.
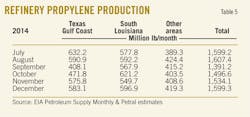
EIA statistics show US refinery-grade propylene production was 50 million lb/day in third-quarter 2014 and was slightly higher in fourth-quarter 2014. Petral Consulting estimates refinery-grade propylene was 50.2-50.4 million lb/day.
EIA reported production from refineries in the Gulf Coast and Midcontinent was 43.0 million lb/day in third-quarter 2014 and 43.1-43.3 million lb/day in fourth-quarter 2014.
Production in third-quarter 2014 was 218 million lb (5.2%) less than in third-quarter 2013. Production in fourth-quarter 2013 was 175-185 million lb (4.3%) less than in fourth-quarter 2013 (Table 5).
Propylene economics, pricing
EIA statistics for refinery-grade propylene production and Petral Consulting's estimates for coproduct supply indicate total US propylene supply in third-quarter 2014 was 74.3 million lb/day and in fourth-quarter 2014 it was 74.6-74.7 million lb/day.
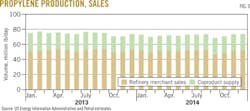
Fig. 5 shows trends in coproduct and refinery merchant propylene sales, as reported by EIA.
EIA statistics show inventory of refinery-grade propylene in Gulf Coast storage averaged 642 million lb in third-quarter 2014. During third-quarter 2014, however, inventory declined by 229 million lb (31.4%) and was 90 million lb (15.1%) less than in third-quarter 2013.
EIA's weekly inventory estimates showed inventory continued to decline in October but rebounded in November and December. Inventory at yearend 2014 was about 165 million lb (33%) more than on Oct. 1. The increase in Gulf Coast inventory increased downward pressure on spot prices for refinery-grade propylene during fourth-quarter 2014.
According to PetroChem Wire, spot prices for refinery-grade propylene averaged 60¢/lb in third-quarter 2014 vs. 57¢/lb in second-quarter 2014. Refinery-grade propylene prices declined in fourth-quarter 2014 and averaged 53¢/lb.
Price premiums for refinery-grade propylene compared with unleaded regular gasoline increased by 6¢/lb in third-quarter 2014 and averaged 16¢/lb. Although refinery-grade propylene prices declined by 7¢/lb in fourth-quarter 2014, prices for unleaded regular gasoline fell more, and price premiums for refinery-grade propylene increased to 23¢/lb.
As was true for crude oil prices, most of the decline in refinery-grade propylene prices occurred in November and December. Prices were 67¢/lb in October but fell to 40¢/lb in December. Premiums vs. unleaded regular gasoline were 31¢/lb in October but narrowed to 16¢/lb in December.
In third-quarter 2014, the contract benchmark for polymer-grade propylene was 67.5¢/lb in July and 72.5¢/lb in August and September. The contract benchmark averaged 70.8¢/lb. It continued to buck falling crude oil and motor gasoline prices in October and increased to 76.5¢/lb, but the benchmark for December fell to 61.5¢/lb and was 15¢/lb less than in October.
The contract benchmark for fourth-quarter 2014 was 69.8¢/lb and only 1¢/lb less than in third-quarter 2014.
As is often the case when the general price levels fall, premiums for polymer-grade propylene vs. refinery-grade propylene were more in fourth quarter than in third-quarter 2014. Polymer-grade propylene prices were 10.5¢/lb more than refinery-grade propylene in third quarter but were 16.4¢/lb in fourth quarter and jumped to 21.7¢/lb in December.
First-half 2015 outlook
In first-half 2014, prices for dated Brent and the OPEC Reference Basket were generally within a range of $105-110/bbl. In third-quarter 2014, dated Brent prices fell to $102/bbl and ORB fell to $101/bbl. By late December, dated Brent was $56/bbl, and prices fell below $50/bbl in the first half of January.
Because of the abrupt swing from stable, strong crude oil prices to unstable, weakening crude oil prices, petrochemical companies now face significant uncertainty. The period of weak crude oil prices will persist for at least 6 months and maybe for 2-3 years. Petral's base case forecast calls for dated Brent and ORB prices to average $40-50/bbl in first-half 2015, and crude oil prices may fall as low as $30/bbl for a month or two.
During 2012-14, US Gulf Coast ethylene producers operated in an environment in which the differential between the highest and lowest cost feedstocks was 30-35¢/lb. During this period, ethane was the lowest cost feedstock in 30 of 36 months and light naphtha was the high-cost feedstock; propane was the lowest cost feedstock in 3 of 36 months, and normal butane was the lowest cost feedstock in 3 of 36 months.
In December 2014, the differential between the highest and lowest cost feedstock was 14¢/lb, and production costs for both propane and normal butane were less than ethane. Petral Consulting forecasts ethylene production costs for all feedstocks except gas oil will be within 5-15¢/lb in first-half 2015, and the differential between the high cost and low cost feed will be 5-10¢/lb.
When crude oil prices are relatively stable, supply-demand considerations and distribution system problems emerge as the primary determinants of variations in spot ethylene prices. During transition periods, the trend in ethylene production costs for the high-cost feedstock becomes the primary determinant for spot ethylene prices.
Petral's forecasts show production costs for natural gasoline and light naphtha streams of similar quality in the range of 10-15¢/lb, but production costs for gas oil feeds will be in the range of 20-30¢/lb. Petral's forecasts for spot ethylene prices in first-half 2015 emphasize the importance of production costs for the high-cost feedstock. The forecast shows spot ethylene prices will average 38-40¢/lb in first-quarter 2015 and 35-38¢/lb in second-quarter 2015.
Profit margins for gas oil will be 12-15¢/lb in first-quarter 2015 and 5-15¢/lb in second-quarter 2015. If ethylene production rates in first-half 2015 are higher than forecast, ethylene inventory will increase to an historical high and supply-demand considerations will become increasingly bearish in second-quarter 2015. Hence, ethylene prices may fall as low as 31-33¢/lb in May-June 2015.
Premiums for spot ethylene prices compared with the benchmark net transaction price were 12-18¢/lb in July-October 2014; 7.7¢/lb in second-quarter 2014. Premiums were 8.5¢/lb in fourth-quarter 2014 and less than 5¢/lb in December.
For first-half 2015, Petral Consulting forecasts premiums for spot prices compared with the benchmark net transaction price will be 3-5¢/lb. Petral forecasts net transaction prices will average 34-36¢/lb in first-quarter 2015 and 32-34¢/lb in second-quarter 2015.
Refinery crude runs in the Gulf Coast and Midcontinent usually decline to minimum seasonal levels in first quarter. Petral forecasts crude runs in first-quarter 2015 will be 400,000-600,000 b/d less than in November-December 2014. Based on typical ratios, Petral also forecasts feed rates for FCCUs in first-quarter 2015 will be 150,000-250,000 b/d less than in November-December 2014.
Propylene marketers often anticipate the bullish impact of the seasonal decline in refinery-grade propylene supply, but the collapse in crude oil prices will outweigh seasonal supply considerations in first-quarter 2015.
Petral forecasts spot prices for refinery-grade propylene will be 33-38¢/lb in first-quarter 2015 and premiums vs. unleaded regular gasoline prices will be 14-18¢/lb. As refinery crude runs and feed rates for FCCUs recover in second-quarter 2015, refinery-grade propylene supply will increase to its seasonal peak. Unleaded regular gasoline prices, however, also increase relative to benchmark crude oil prices.
In first-half 2015, however, coproduct propylene supply will be 2-3 million lb/day higher than in first-half 2014. Petral forecasts for refinery-grade propylene prices incorporate the bearish influence of the increase in polymer-grade propylene coproduct supply. Petral forecasts the increase in coproduct supply will squeeze refinery-grade propylene price premiums compared with unleaded regular gasoline to 4-6¢/lb and spot prices will fall to 28-32¢/lb in second-quarter 2015.
According to PetroChem Wire's daily report, the contract benchmark price for polymer-grade propylene fell 10¢/lb in December to 61.5¢/lb. PetroChem Wire also reported the contract benchmark settled at 49.5¢/lb in January. Petral forecasts the contract benchmark will decline to 32-33¢/lb by May or June.
Unless unexpected circumstances cause Saudi Arabia to reverse course and return to an emphasis on "highest practical price" or US crude oil production goes into significant decline during first-half 2015, the trend in crude oil prices will remain bearish and the bearish bias will dominate price trends for ethylene and propylene.
Feedstock prices, coproduct values, and ethylene plant yields determine ethylene production costs. Petral Consulting maintains direct contact with the olefin industry and tracks historic trends in spot prices for ethylene and propylene. We use a variety of sources to track trends in feedstock prices.
Some ethylene plants have the necessary process units to convert all coproducts to purity streams. Some ethylene plants, however, do not have the capability to upgrade mixed or crude streams of various coproducts and sell some or all their coproducts at discounted prices. We evaluate ethylene production costs in this article based on all coproducts valued at spot prices.
The author
