SECOND-HALF 2006: US olefins producers struggle despite lack of major storms
The absence of hurricanes during third-quarter 2006 created problems for US olefin producers in the fourth quarter. These problems, however, were minor compared with problems caused by the fires and hurricanes during third-quarter 2005.
After the disruptions to plant operations and loss of supply in the aftermath of Hurricanes Katrina and Rita in 2005, many petrochemical company buyers decided to be better prepared for the expected instant replay during the 2006 hurricane season. Many olefins producers reported that customers were prebuying and accumulating inventory during the second and third-quarter 2006 to ensure adequate supplies to offset expected supply disruptions due to hurricanes.
The 2006 hurricane season, however, proved to be nearly nonexistent and the Gulf of Mexico saw no hurricanes at all. For those petrochemical buyers that stockpiled in anticipation of hurricanes, accumulated surplus inventories had to be liquidated. The absence of any hurricane-related disruptions, therefore, resulted in a slump in demand during fourth-quarter 2006.
The olefin industry, however, was buffeted by the economic storm caused by the refining industry’s abrupt conversion from methyl tertiary butyl ether to ethanol. During second and third quarter, ethanol supply was tight, some areas experienced ethanol supply allocations, and octane values remained extraordinarily strong through yearend 2006.
The sustained strength in octane values directly affected spot prices for propylene and aromatics. The strength in propylene and aromatics prices, in turn, influenced olefin plant feedslate decisions.
Olefin plant feed slates
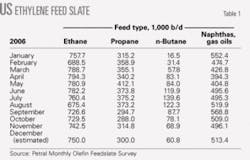
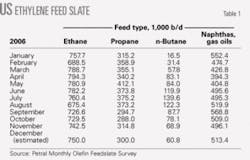
Ethylene producers increased consumption of ethane and propane to 1.12 million b/d in May 2006. Feedstock demand for ethane and propane in May proved to be the high for 2006.
When the value of octane rose and coproduct prices strengthened, feedstock economics for naphthas and other heavy feeds became more favorable after May. Feedstock demand for ethane and propane, therefore, in third-quarter 2006 declined 93,000 b/d and averaged 1.07 million b/d vs. 1.16 million b/d in the second quarter. Demand for ethane and propane declined again in the fourth quarter, averaging 1.02 million b/d.
Table 1 shows recent trends in olefin plants’ feed slates.
Ethane and propane accounted for 69% of the industry’s total consumption of fresh feed in second-quarter 2006 but accounted for only 62% in third-quarter 2006 and 63% in fourth-quarter 2006. Ethane’s share of fresh feed declined to 42% in third-quarter 2006 but rebounded to about 46% in the fourth quarter.
Propane’s share of fresh feed is usually at its highest level for the year during third quarter but generally declines in fourth quarter. In 2006, propane’s share of fresh feed averaged 22% in second quarter and 20% in third quarter. Consistent with the historic seasonal pattern, propane’s share of fresh feed declined to 19% in fourth-quarter 2006.
Because the value of coproducts increased and cracking economics for naphthas improved, demand for naphthas and other heavy feeds rebounded in third-quarter 2006. Consumption of heavy feeds averaged 528,000 b/d in third-quarter 2006 vs. 432,000 b/d in second-quarter 2006. Even though total demand for fresh feed declined in fourth-quarter 2006, demand for heavy feeds was nearly constant and averaged 523,000 b/d.
Olefin producers did not operate at full capacity at any time in 2006. Total demand for fresh feed was its highest level during third-quarter 2006; consumption averaged 1.71 million b/d vs. 1.78 million b/d in first-quarter 2005 (the high quarter for 2005).
In response to demand weakness for various olefin derivatives, total demand for fresh feed declined in fourth-quarter 2006 and averaged only 1.61 million b/d.
Ethylene plants will run at 90-92% of available capacity during first-half 2007, and total demand for feedstocks will increase to 1.65 million b/d during that period. Retail demand for propane generally declines after January and availability for US Gulf Coast feedstock market improves.
Similarly, refinery demand for normal butane will fall sharply during first quarter and will reach its seasonal low during second quarter. Feedstock demand for propane and normal butane will increase during first-half 2007.
The outlook for ethane demand, however, is somewhat more complicated. For the first time in several years, ethane availability may likely constrain feedstock demand during the first half of 2007.
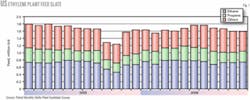
Figs. 1 and 2 show historic trends in ethylene feed slates.
Ethylene production
In second-quarter 2006, available nameplate ethylene capacity averaged 60.2 billion lb vs. the industry’s full nameplate capacity of 61.2 billion lb/year.
In April 2006, Formosa Petrochemical Corp. and Innovene LLC completed repairs to their facilities. Huntsman Chemical Co.’s plant at Port Arthur, Tex., however, experienced an explosion and major fire in late April and was out of service for 2006. According to official company statements, this plant will be out of service through at least second-quarter 2007.
Finally, a turnaround in April and May reduced available capacity by 1.9 billion lb/year for about 50 days. In third-quarter 2006, the industry’s full nameplate capacity totaled only 59.7 billion lb/year due to loss of capacity at Huntsman’s plant.
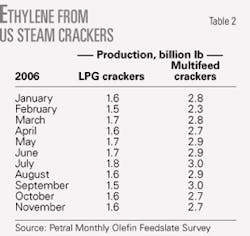
Ethylene production from U.S. olefin plants totaled 13.5 billion lb in second-quarter 2006 (Table 2). The industry’s operating rate averaged 90.2% on a full nameplate basis and 91.8% on an adjusted-capacity basis.
Production in second-quarter 2006 was 0.83 billion lb more than in first-quarter 2006. Ethylene production in second-quarter 2006 was almost equal to prehurricane volumes in first and second-quarter 2005 (13.9 billion lb and 13.7 billion lb, respectively). Ethylene production from LPG crackers increased 0.22 billion lb and production from multifeed crackers increased 0.61 billion lb during second-quarter 2006.
Ethylene production increased again in third-quarter 2006 and totaled 13.8 billion lb, or 0.24 billion lb more than in second-quarter 2006. The industry’s operating rate averaged 91.5% on a full nameplate basis (excluding the capacity at Huntsman’s Port Arthur plant) and 93.2% on an adjusted-capacity basis (accounting for downtime due to turnarounds). Production from LPG crackers declined 0.16 billion lb but production from multifeed crackers increased 0.4 billion lb.
LPG crackers accounted for 35% of total production in third-quarter 2006 and operated at 90.5% of nameplate capacity. Multifeed crackers accounted for 65% of production and operated at 92.1% of capacity in third-quarter 2006.
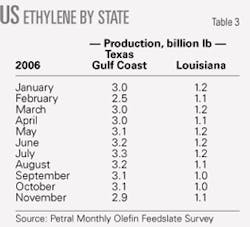
Table 3 shows ethylene production from plants in Texas and Louisiana.
US propylene production
Spot prices for chemical-grade propylene averaged 47¢/lb in second-quarter 2006 and 48¢/lb in third-quarter 2006. Spot prices for chemical-grade propylene were 3.8¢/lb higher than in first-quarter 2006. Despite the increase of almost 4¢/lb in second quarter, propylene price relationships vs. unleaded regular gasoline and alkylate weakened in second quarter but rebounded sharply in third-quarter 2006.
Spot prices for aromatics (especially benzene and xylenes) also increased in second and third quarters. Total coproduct credits for light naphthas increased 5¢/lb in second-quarter 2006 and 2.3¢/lb in third quarter.
Increases in coproduct credits contributed to significant improvements in economic incentives for propane and light naphthas. Feedstock demand, therefore, for propane and heavy feedstocks increased and coproduct propylene production from olefin plants increased in second and third quarters.
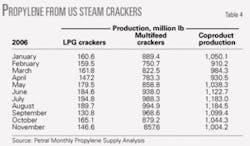
Propylene from steam crackers totaled 3.1 billion lb in second-quarter 2006 or 150 million lb more than in first-quarter 2006. In third quarter, coproduct propylene production totaled 3.5 billion lb or 377 million lb more than in second-quarter 2006.
Table 4 shows trends in coproduct propylene production from LPG and multifeed plants.
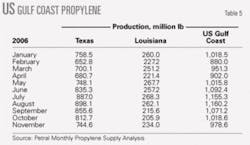
In second-quarter 2006, propylene production from olefin plants in Texas was 2.28 billion lb (Table 5), and the propylene-ethylene production ratio averaged 24.1% vs. 24.7% in first-quarter 2006. In third-quarter 2006, propylene production from olefin plants in Texas increased 380 million lb and totaled 2.66 billion lb. The propylene-ethylene production ratio averaged 27% in third-quarter 2006.
Propylene production in Louisiana totaled 0.74 billion lb in both second and third-quarter 2006. The propylene-ethylene production ratio averaged 21.2% in second quarter and 22.1% in third quarter.
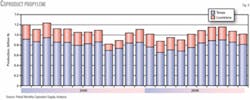
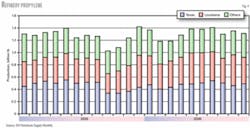
Fig. 3 shows trends in coproduct propylene production from olefin plants in Texas and Louisiana.
Refinery propylene supply
Merchant sales of refinery-grade propylene usually increase in second and third quarters due to seasonal factors. Refineries generally operate at full capacity after April. Additionally, refineries typically operate FCC units in maximum gasoline mode. By-product propylene yields from FCC units are therefore usually somewhat higher in second and third quarters vs. the first and fourth quarters.
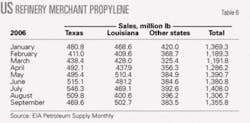
Consistent with typical seasonal trends, merchant sales of refinery-grade propylene totaled 4.06 billion lb in second-quarter 2006, or 307 million lb more than in first-quarter 2006. In third-quarter 2006, however, merchant sales of refinery propylene totaled 4.07 billion lb (Table 6) or almost the same as in second-quarter 2006.
In fourth-quarter 2006, refinery merchant sales of propylene will be 1.40-1.45 billion lb/month and production will total 4.00-4.25 billion lb.
Fig. 4 shows trends in refinery merchant propylene sales.
Propylene inventories
According to the US Energy Information Agency’s weekly inventory report, refinery-grade propylene inventories were consistently 500-600 million lb during the second and third-quarter 2006 except during July. Inventories of refinery-grade propylene increased 162 million lb and totaled 747 million lb on Aug. 1. During August 2006, inventories declined 234 million lb and totaled only 513 million lb on Sept. 1.
Fig. 5 shows trends in refinery-grade propylene inventories.
Ethylene economics, prices
Feedstock prices, coproduct values, and ethylene plant yields determine ethylene production costs. We maintain direct contact with the olefin industry and track historic trends in spot prices for ethylene and propylene. We use a variety of sources to track trends in feedstock prices.
Some ethylene plants have the necessary process units to convert all coproducts into high-purity streams. Some ethylene plants, however, do not have the capability to upgrade mixed or crude streams of various coproducts; they sell some or all their coproducts at discounted prices. We evaluate ethylene production costs in this article based on all coproducts valued at spot prices.
Ethylene production costs
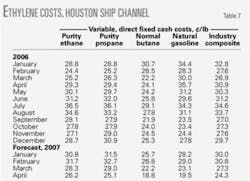
During second-quarter 2006, spot prices for most feedstocks and coproducts increased. The rebound in feedstock prices outweighed the increases in coproduct prices and the Houston Ship Channel composite production cost (variable costs plus fixed cash costs) averaged 31¢/lb.
In third-quarter 2006, feedstock prices reached their highs for the year (July and August) but coproduct credits were only modestly higher than in second quarter. The Houston Ship Channel composite production cost therefore rose 1.8¢/lb and averaged 32¢/lb.
A general decline in prices for all petroleum products began in August and accelerated in September; thus, the Houston Ship Channel composite production cost declined by almost 4¢/lb during fourth-quarter 2006 and averaged 28¢/lb.
Table 7 summarizes trends in ethylene production costs.
Ethylene prices, profit margins
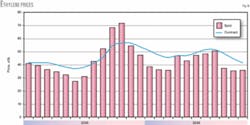
Contract prices for ethylene averaged 46.5¢/lb in the second quarter, down from 50.5¢/lb in first-quarter 2006. Contract prices rebounded significantly in third quarter and averaged about 51¢/lb. Contract prices, however, fell to 41.5¢/lb in December and averaged almost 45¢/lb in fourth quarter.
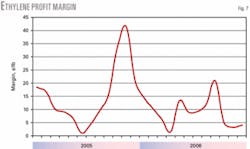
During second-quarter 2006, spot prices for ethylene increased to 47¢/lb in May from 36¢/lb in April but then declined to 43¢/lb in June. Spot prices averaged 42¢/lb in second quarter vs. 41¢/lb in first quarter. Despite the increase in spot ethylene prices during second quarter, the industry’s profit margin (spot prices minus cash production costs) averaged only 12.2¢/lb vs. 14.4¢/lb in first quarter.
Spot prices for ethylene staged a strong rally during third quarter and averaged 48.8¢/lb. Spot prices reached a 2006 peak of 50.5¢/lb in September. The rally in spot ethylene prices and the decline in production costs pushed profit margins to 23.1¢/lb in September vs. 11.8¢/lb in July. For third-quarter 2006, profit margins averaged 18.3¢/lb.
Although delayed by 2 months, spot prices for ethylene succumbed to the general decline in spot prices for petroleum products. The end was abrupt and brutal and spot prices in October fell to a low of 32¢/lb at month’s end. For fourth-quarter 2006, spot prices for ethylene averaged 34.4¢/lb or 14.4¢/lb lower than the average for third-quarter 2006.
Profit margins based on spot prices and total cash costs collapsed in fourth quarter and averaged only 8.5¢/lb or almost 10¢/lb lower than in third quarter.
Figs. 6 and 7 show historic trends in ethylene prices and profit margins.
Propylene economics, prices
Prices for all grades of propylene move in tandem with each other, and differentials between grades are generally constant within a narrow range. The premium for polymer-grade propylene covers operating costs and profit margins for various merchant propane-propylene splitters in Texas and Louisiana.
During third-quarter 2006, spot prices for refinery-grade propylene prices increased to a high of 48¢/lb in August but weakened slightly in September and averaged about 47.75¢/lb. Spot prices for refinery-grade propylene moved higher even though spot prices for unleaded regular gasoline fell by 26¢/gal in August and an additional 45¢/gal in September. Similarly, spot prices for alkylate declined by 108.5¢/gal or about 18¢/lb during third quarter.
The strength in spot prices for refinery-grade propylene was even more surprising given the increase in total propylene production during third quarter.
Spot prices for refinery-grade propylene finally succumbed to bearish economic and supply prices during October and November. After contract prices for refinery-grade propylene settled at 45.5¢/lb, spot prices fell abruptly and averaged about 36¢/lb or almost 12¢/lb lower than in September. Spot prices continued to decline in November and averaged about 33.5¢/lb.
Contract prices followed suit and settled at 34.5¢/lb in November or 9¢/lb lower than in October. The market for refinery-grade propylene found a temporary equilibrium in December. Contract prices settled at 35¢/lb and spot prices averaged 34.5¢/lb.
Polymer-grade propylene prices usually command a premium of 4-5¢/lb vs. refinery-grade propylene. During third quarter, the premium for polymer-grade propylene (contract-price basis) was 5.5¢/lb in July, narrowed to 4.0¢/lb in August, and recovered to 4.75¢/lb in September. For third quarter, the contract-price premium for polymer-grade propylene averaged 4.75¢/lb.
In October, the contract price for polymer-grade propylene declined 4¢/lb vs. a decline of only 3.25¢/lb for refinery-grade propylene; the polymer-grade premium narrowed to 4.0¢/lb. Merchant splitters recouped the loss in November when the contract premium for polymer-grade propylene widened to 6.0¢/lb. In December, the premium narrowed slightly to 5.0¢/lb and averaged 5.2¢/lb for fourth-quarter 2006.
Octane values
We determine octane’s incremental value using the differential between unleaded premium and unleaded regular gasoline prices divided by the difference in octane (87 octane for unleaded regular gasoline and 93 octane for unleaded premium gasoline).
During second quarter, incremental octane values increased to 3.2¢/octane-gal in June vs. 1.3¢/octane-gal in April. The rally in octane values continued into third-quarter 2006 and peaked in August at 4.3¢/octane-gal (about four times greater than the historic average).
In September, however, incremental octane values dipped to 2.6¢/octane-gal. Octane values were nearly constant in October but rebounded to 3.2¢/octane-gal in November and December.
We can evaluate the relative strength in refinery-grade propylene prices by tracking differentials vs. US Gulf Coast spot prices for unleaded regular gasoline, spot prices for unleaded regular gasoline in the Chicago pipeline market, and by comparison with Gulf Coast spot alkylate prices.
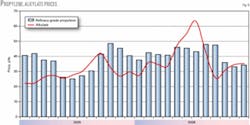
Fig. 8 shows trends in spot prices for refinery-grade propylene and alkylate.
During second-quarter 2006, price premiums for refinery-grade propylene vs. spot alkylate weakened significantly and averaged 2.6¢/lb. Premiums ranged from a low of 0.3¢/lb in April to 5.3¢/lb in May.
Differentials between refinery-grade propylene and alkylate were dramatically more volatile during third quarter. Alkylate prices reached a high of about 47¢/lb in July but refinery-grade propylene prices dipped to 43.3¢/lb; therefore, spot prices for refinery-grade propylene averaged 3.8¢/lb less than alkylate in July.
By September, alkylate prices fell to 29.5¢/lb but refinery-grade propylene prices rallied to 47.8¢/lb and the premium surged to 18.3¢/lb. For third quarter, refinery-grade propylene premiums averaged 7.7¢/lb.
Outlook
Crude inventories declined by 4 million bbl during third-quarter 2006 and 2-4 million bbl during fourth quarter. Crude inventories totaled 320 million bbl at yearend and were about the same as year-earlier volumes.
Unless crude producers in the Middle East experience a substantial supply disruption or voluntarily reduce production by 1 million b/d and maintain strict discipline on voluntary production cuts, continued growth in crude production from non-OPEC sources will increase bearish pressures on prices throughout 2007.
Octane values, however, will average 2.25-2.50¢/octane-gal during first-half 2007 vs. 2.95¢/octane-gal in fourth-quarter 2006. In summary, price forecasts for ethylene, propylene, and ethylene feedstocks are based on spot prices for West Texas Intermediate crude in the range of $58-62/bbl during first-quarter 2007 and $55-58/bbl in second-quarter 2007.
The projected decline in WTI prices during second-quarter 2007 will decrease spot prices for all feedstocks and will reduce composite production costs by 5-7¢/lb.
During first-quarter 2007, cash production costs will be about the same as fourth-quarter 2006, but the expected rebound in demand should boost profit margins by 2-4¢/lb. As a result, spot ethylene prices will average 37-39¢/lb or about 3-4¢/lb higher than in fourth-quarter 2006.
In second-quarter 2007, cash production costs will decline by 5-6¢/lb. Spot ethylene prices will average 35-37¢/lb during second-quarter 2007 and profit margins will improve to 16¢/lb vs. 10¢/lb during first-quarter 2007.
Spot prices for refinery-grade propylene will average 36-38¢/lb during first-quarter 2007 and 37-39¢/lb in second-quarter 2007. Based on these price forecasts, refinery-grade propylene prices will average 4-6¢/lb higher than spot alkylate during first-quarter 2007. Premiums vs. spot alkylate will widen to 7-9¢/lb during second-quarter 2007.
Contract prices for polymer-grade propylene will average 4.75-5.25¢/lb higher than refinery-grade propylene during the first half of 2007.
The author
Daniel L. Lippe (danlippe@ petral.com) is president of Petral Worldwide Inc., Houston. He founded Petral Consulting Co. in 1988 and cofounded Petral Worldwide in 1993. He has expertise in economic analysis of a broad spectrum of petroleum products including crude oil and refined products, natural gas, natural gas liquids, other ethylene feedstocks, and primary petrochemicals. Lippe began his professional career in 1974 with Diamond Shamrock Chemical Co., moved into professional consulting in 1979, and has served petroleum, midstream, and petrochemical industry clients since that time. He holds a BS (1974) in chemical engineering from Texas A&M University and an MBA (1981) from Houston Baptist University. He is an active member of the Gas Processors Association, serving on the NGL Market Information Committee and currently serving as vice-chairman of the committee.
