Technique identifies maximum depth for commercial deepwater production
Millions of dollars are spent drilling and completing Gulf Coast and Gulf of Mexico wells that have no chance for commercial hydrocarbon recovery.
Knowing the maximum depth from which commercial production is possible would be invaluable, particularly in deepwater areas. This article points out a technique that can be used to establish these maximum depths for commercial production using a relatively simple petrophysical approach.
The author has been defining and refining the technique for the past 40 years. All previously published work was initiated before deepwater drilling began, so the emphasis of this article will be to apply these techniques to deepwater prospect areas.
The author’s attention has been piqued recently as to why much deeper commercial production is possible in deepwater areas than is possible in shelf and onshore areas.
The commerciality of oil and gas production along the Gulf Coast, both onshore and offshore, can be determined using petrophysical data in a nonconventional manner. In fact, conventional log analysis and associated data can lead to erroneous conclusions regarding the quality of production.
Reservoirs that look exceptionally good from log analysis sometimes don’t produce as expected and cause disastrous financial results. In other words, we need to include readily available formation pressure and temperature data to assist in determining reservoir quality.
Commercial envelope
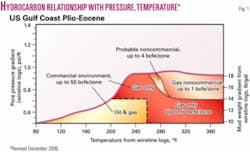
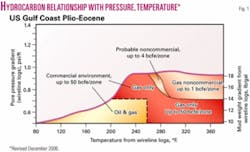
Fig. 1 is a plot of formation pore pressure gradient vs. formation temperature as derived from wireline logs. With few exceptions, the expected quality of production can be determined from the plot. All commercial production must fall within the bell-shaped curve envelope.
Using this pressure/temperature relationship, we can actually quantify expected hydrocarbon recoveries as indicated on the figure. Note that commercial volumes of oil are limited to areas where formation temperatures do not exceed 270° F. and formation pressure gradients do not exceed 0.7 psi/ft.
Commercial gas, however, can be found in most all pressure/temperature environments. The majority of fields are limited to areas where the temperatures are less than 300° F. and pressures are lower than a 0.73 psi/ft gradient as determined by log pore pressure plots.
There are exceptions to this rule, as commercial gas can be produced from areas with temperatures exceeding 300° F. and pressures well above the 0.73 psi/ft gradient. These exceptions, however, are recognizable using petrophysical data in the manner discussed in detail below.
Shale resistivities
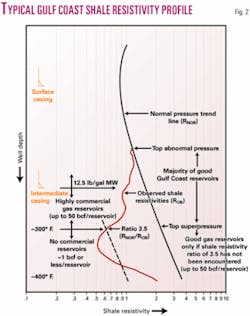
Fig. 2 is an example of a typical Gulf Coast shale resistivity versus depth plot for onshore and shelf wells. Usually, the top of the abnormal pressure transition is encountered between 6,000 ft and 10,000 ft. With surface pipe normally set at around 3,000 ft, the intermediate string is set in the pressure transition zone in a pore pressure gradient of about 12.5 ppg mud weight equivalent.
It should be noted that 90% of Gulf Coast commercial oil is found above this intermediate pipe-setting depth. This is not true in deepwater areas, where the intermediate pipe may be set for reasons other than formation pressure and fracture gradients. It is interesting to note that except for deepwater area wells, when intermediate pipe depth is reached and pipe is set to drill deeper, about 50% of the total well costs have been spent and below this depth we are drilling for gas and not oil.
Below the intermediate pipe depth, highly commercial gas and gas-condensate reservoirs are present. Shale resistivities will generally continue to decrease with increasing depth and formation pore pressure.
If the shale resistivities decrease to a value where the extrapolated normal trend value is 3.5 times greater than the actual value, commercial production below this point cannot be encountered. This cutoff point is usually at a reservoir temperature near 300° F. and a pore pressure gradient equivalent to a 17 ppg mud weight as determined by well logs. Any gas reservoir found below this 3.5 ratio cutoff will be breached, as the formation fracture gradient at one time in the past has exceeded the overburden stress and gas has been lost.
With deeper drilling, the shale ratio usually decreases (shale resistivities increase) below the 3.5 ratio cutoff, giving the appearance of a pore pressure regression.
Quality looking gas sands, as indicated by mud logs, wireline logs, and such predrill data as geophysical “bright spots,” will be in error regarding expected recoveries. When put on production, these zones will deplete in a short time without having produced commercial volumes of gas.
Gas recovery is almost always less than 1 bcf/zone, and exploration people are prone to say that engineers have “messed up the well.” Unfortunately, subsequent wells get drilled based on these “excellent shows,” and further dollars are spent needlessly.
HP/HT environments
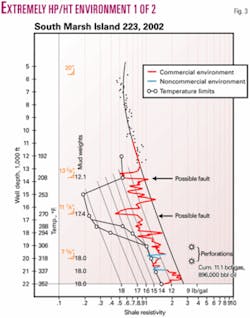
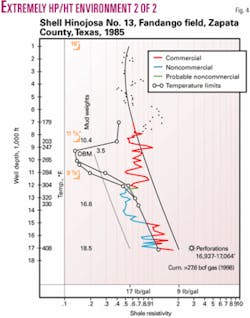
Figs. 3 and 4 are examples of shale resistivity plots in extremely high pressure and temperature environments.
Superimposed on these figures is the bell shaped P/T curve envelope from Fig. 1. This curve is easily included once we have determined the temperature gradient from the log-measured bottomhole temperature. The maximum pressure gradient, in terms of mud weight, for any temperature can be included.
Fig. 3 is the shale resistivity of a shelf well from South Marsh Island Block 223. This well encountered thick commercial pays below 19,000 ft in a very high P/T environment. Note that the 3.5 shale ratio value (17 ppg gradient) was never reached in the shallower part of the well. Any gas reservoirs, therefore, found in this well down to 22,000 ft are potentially commercial, although commercial oil is not possible.
This is a good example of “non-breached reservoirs.” Also note that the shale resistivity values in the vicinity of the pay sands fall within the commercial envelope of Fig. 1, indicating pore pressures of 14 ppg equivalent or less. This appearance of moderate pore pressure is erroneous and is one of the pitfalls in using well logs to accurately determine formation pore pressure.
Fig. 4 is the profile of a highly commercial South Texas Eocene producer in a HP/HT environment to 17,200 ft. This well finished with 18.5 ppg mud weight and log measured temperature exceeding 400° F. The well was completed with perforations at 16,937-17,064 ft and produced 27.6 bcf of gas from 1985 to 1998. Note that the shale resistivity ratio never reached 3.5.
This well is also an example of the condition that commercial reservoirs, as in this case, are most always sandwiched between shales that from logs indicate pore pressures less than 14 ppg gradients. This again fits within the commercial envelope of Fig. 1. These commercial intervals below 15,000 ft are colored in red in Fig. 4. Any sands with gas within these intervals can be commercially productive, which is the case in Fandango gas field, Zapata County, Tex.
Nonproductive drilling
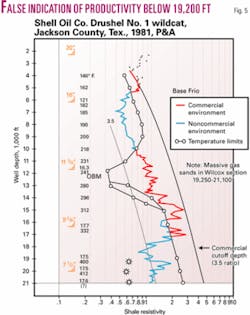
Fig. 5 is another deep Eocene test in Jackson County, Tex., that is potentially productive to 18,100 ft. Unfortunately, the massive gas sands present from 19,250 ft to TD are not commercially prospective even though geological and geophysical data could possibly indicate otherwise.
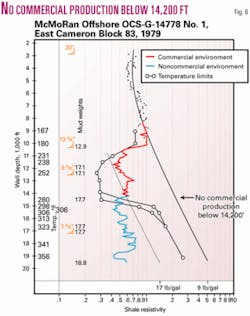
Fig. 6 is another story. This offshore shelf well from East Cameron Block 83 has no potential for commercial production below 14,200 ft. At this depth, the shale resistivity ratio reached and exceeded 3.5. This is the maximum depth in this area for commercial production.
Even if pore pressure did appear to decrease with depth, it would make no difference once the shale ratio cutoff value has been encountered at a shallower depth, as in this well at 14,200 ft. Any gas sands found in this well below 14,200 ft would deplete before producing commercial volumes, less than 1 bcf as indicated by Fig. 1.
The lesson learned here is that the money spent drilling from 14,200 ft to TD at 19,500 ft could be better spent on another prospect.
False positives
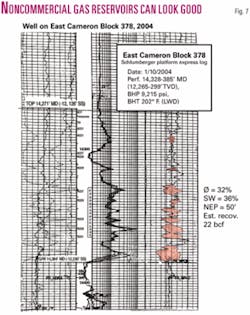
Unfortunately, the gas reservoirs present in these noncommercial environments can look good on mud logs, cores, wireline and LWD logs, and wireline formation tests.
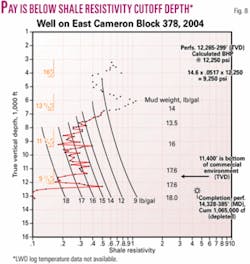
An example of the above is Fig. 7, which is the log section of the pay interval of a well drilled in East Cameron Block 378. By conventional log analysis and wireline formation tests, the well looks exceptionally good. Unfortunately, the shale resistivity profile indicates this pay at 12,265-299 ft TVD (14,328-365 ft MD) is well below the 3.5 shale resistivity cutoff depth at 11,400 ft TVD (Fig. 8).
As expected, this well depleted after producing about 1 bcf in 4 months. Fig. 8 is a plot from an LWD log. Temperature data were not available. The shale resistivity data alone, however, are sufficient to make our conclusion.
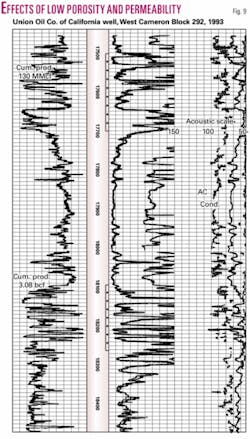
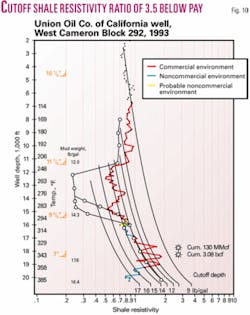
Fig. 9 is a log section of gas pay intervals in a West Cameron Block 292 well, and Fig. 10 is the P/T profile. Note that these two gas pays fall into the commercial envelope of Fig. 1. Also note from Fig. 10 that the cutoff shale resistivity ratio of 3.5 was not reached until 19,800 ft.
The deeper sand was perforated at 18,086-260 ft and produced a total of 3.08 bcf, which at best is borderline commercial. The upper zone was perforated at 17,476-684 ft and produced only 130 MMcf.
Quantitative interpretation of the logs indicates a maximum porosity of 16% and water saturation of 30% with a log-estimated permeability of less than 1 md.
This well performed poorly because of the low porosity and permeability, even though it is in a good P/T environment. Many onshore fields along the Gulf Coast exhibit the same reservoir characteristics and produce at commercial rates and volumes only after fracture stimulation. This well, therefore, would be such a candidate.
Deepwater attributes
Recently, the industry has uncovered the fact that in deepwater drilling areas commercial oil and gas can be found in reservoirs much deeper than on the shelf or onshore areas. The basic reason for this is that lower pressure and temperature gradients are present at comparable depths to shelf and onshore areas. To date, although data are limited, the author has not found a well that has reached the shale resistivity cutoff depth for commercial production.
It is expected that commercial production can be achieved to ±30,000 ft before reaching cutoff P/T levels. Also, commercial oil zones can be achieved to much deeper depths in the deepwater drilling areas than the shelf and onshore areas.
The US Minerals Management Service has reported that 60% of the deepwater hydrocarbon production is oil. In other words, we do not reach the borehole temperature cutoff of 270° F. and the pore pressure gradient of 0.7 psi/ft for oil until about 20,000 ft.
Another reason for finding more prolific hydrocarbon production in deepwater areas is that the pressure transition, on average, is extended over a longer depth interval than shelf and onshore areas, and therefore there is the probability of encountering more and thicker pay sands.
Deepwater examples
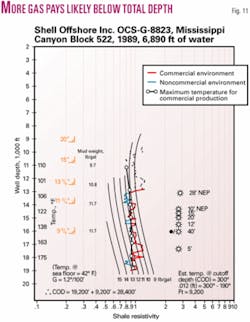
Fig. 11 is an example from a well drilled in 6,890 ft of water in Mississippi Canyon Block 522.
The well was bottomed at 19,200 ft in about a 13 ppg mud weight gradient environment. The measured wireline BHT was 190° F., and this temperature is equivalent to a gradient of 1.2° F./100 ft. This well, therefore, is still in a commercial oil environment at 19,200 ft.
Note that the pore pressure transition is topped at 12,900 ft and extends to TD. Through this interval, the shale pore pressure is relatively constant until about 18,400 ft, where there is a slight increase. There are seven pay sands in this transition zone with a cumulative pay thickness of 120 ft.
With the temperature gradient of 1.2 at 19,000 ft, we can estimate that we will reach the commercial cutoff temperature of 300° F. at about 28,400 ft. Also, we can speculate that the pore pressure will probably reach the 17 ppg gradient (3.5 shale ratio) at this depth.
This well, therefore, has an additional commercial pay interval of 9,222 ft below the present TD. However, since we are approaching the maximum pore pressure for oil at 19,200 ft, any pay zones encountered would most likely be gas.
Even in this low P/T environment as exhibited by Fig. 11 and subsequent figures of wells drilled in deepwater areas, the pay sands still fall within the commercial envelope of Fig. 1. Note that the shales immediately above and below the hydrocarbon pay sands show a decrease in shale ratios (decrease in shale pore pressures) from shales more distant from the pays.
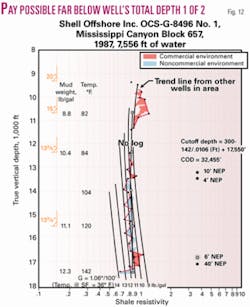
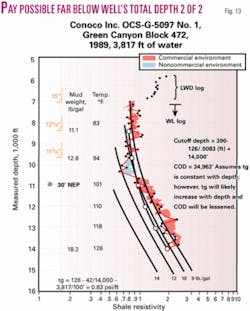
The commercial pay environments are colored red on the figures, and the noncommercial environments are indicated in blue.
It is apparent that the sands and shales in the transition zone are not at the same pore pressure, and the sands have less pressure than the shales. These blue colored shale zones with temperatures that fall above the temperature envelope of Fig. 1 are usually the “gumbo type” and are sensitive to water-base muds. Caliper logs run through these intervals almost always show hole enlargement over bit size.
Deepening desirable
Here are examples of two wells at which the potentially commercial environment extends far deeper than the depth at which drilling stopped.
Fig. 12 is a well drilled in Mississippi Canyon Block 657. This well is in slightly deeper water than the Block 522 well, and the estimated commercial cutoff depth is 32,455 ft.
Although this well has an apparent cutoff depth deeper than the Block 522 well of Fig. 11, the log measurement depths are not TVD, and depth corrections must be made before a direct comparison is possible.
Two factors that would affect any depth differences in the wells are that there probably is a structural difference between the wells and the sea floor is cooler at the Block 657 location.
The shale plot from a Green Canyon well drilled in Block 472 in 3,817 ft of water is shown in Fig. 13. This well was drilled to 14,000 ft and did not reach nearly its potential productive depth. The measured wireline BHT was only 126° at TD, and the temperature gradient calculates to be 83°/100 ft. Extrapolating this gradient deeper would indicate a maximum commercial cutoff depth of 33,036 ft.
These estimated cutoff depths for wells drilled in deep water should be considered as the maximum possible depths for commercial production. It is probable that the temperature gradient would increase with depth, which would lessen the calculated cutoff depth somewhat.
The only absolute conclusion that can be made is that in deepwater areas, commercial oil and gas reservoirs can be found at much deeper depths than in shelf and onshore areas.
Bibliography
Timko, Don, “How to use petrophysical data to determine deep prospectivity,” OGJ, Mar. 1, 2004, p. 32.
Timko, Don, AIME fall meeting, SPE 2990, October 1970.
Timko, Don, JPT, August 1971.
Timko, Don, series of articles published in World Oil, June 1972 to March 1973.
The author
Donald J. Timko ([email protected]) is a consultant specializing in defining reservoir production quality from petrophysical data. He initiated work on pressure, temperature, and hydrocarbon relationships during almost 2 decades with Conoco Inc. From 1973 to 2000 he was an independent operator. He has been an SPE distinguished lecturer, was president of SPWLA, and has taught seminars on well log interpretation. He is a graduate of the University of Pittsburgh.
