BP: Oil gained global market share in 2016 for second straight year
Energy markets are adjusting effectively to near-term challenges, with the oil market in particular adjusting in 2016 to the oversupply that has dominated it in recent years, BP PLC said in the 66th edition of its Statistical Review of World Energy.
Global energy demand in 2016 was weak for a third consecutive year, rising by just 1%, about half the average growth rate of the past decade. Almost all the growth again came from fast-growing developing economies such as China and India, which together accounted for half of all growth.
Indian energy demand rose 5.4%, a similar rate to that seen in recent years. Chinese demand, however, increased 1.3%, close to its 1.2% rise in 2015 and about a quarter of its 10-year average growth.
China’s average growth during 2015-16 was its lowest over a 2-year period since 1997-98. Despite the slowing, the incremental increase made China the world’s largest energy growth market for a 16th consecutive year.
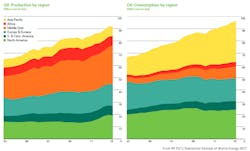
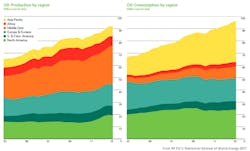
Oil remained the world’s leading fuel in 2016, accounting for a third of global energy consumption, BP said. It gained global market share for the second year in a row following 15 years of declines from 1999 to 2014 (OGJ Online, June 8, 2016).
Global oil consumption grew strongly, rising 1.6%, or 1.6 million b/d, above the 10-year average rate for a second consecutive year. Big increases in demand were seen from India and Europe, each up 300,000 b/d. Demand from China increased 400,000 b/d, also lower than in recent years.
Weak prices in 2016 impacted the growth of global oil production, which rose just 0.5%, or 400,000 b/d, the lowest increase since 2009. Given the strong growth in demand and weak production growth, the oil market returned broadly back into balance by midyear, but prices remained depressed by the large overhang of built-up inventories.
Production from the Organization of Petroleum Exporting Countries increased 1.2 million b/d, with Iran up 700,000 b/d, and Iraq and Saudi Arabia each up 400,000 b/d. Non-OPEC oil production fell 800,000 b/d, the largest annual decline in about 25 years. The US dropped 400,000 b/d, and China and Nigeria each lost 300,000 b/d.
Global refinery throughput growth slowed to 600,000 b/d last year from 1.8 million b/d in 2015. Refining capacity grew just 440,000 b/d vs. 10-year average growth of 1 million b/d, causing refinery utilization to rise.
Changing global gas markets
Global natural gas consumption in 2016 rose 1.5%, or 63 billion cu m (bcm), slower than the 10-year average rate of 2.3%, according to the review. However, there were strong increases in gas consumption in Europe, up 28 bcm; the Middle East, up 19 bcm; and China, up 16 bcm. Russia saw the largest drop in consumption of any country at 12 bcm.
Global gas production increased only 0.3%, or 20 bcm, the weakest growth in gas output for 34 years outside the financial crisis. With lower gas prices, US gas production fell for the first time since the shale gas revolution began as overall North American output dropped 21 bcm. Australian gas production jumped 25%, or 19 bcm, as new LNG facilities came on stream.
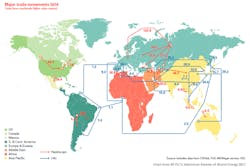
Driven by the new Australian output, global LNG imports-exports grew 6.2%. US LNG exports rose to 4.4 bcm in 2016 from 0.7 bcm in 2015. Global LNG production is expected to grow about 30% by 2020, which is equivalent to a new LNG train coming on stream every 2-3 months for the next 4 years.
BP explained the rise of LNG trade reflects an ongoing continuing fundamental shift in global gas markets toward greater integration but also toward more competitive and flexible markets, with increasing volumes of LNG under shorter or smaller contracts or uncontracted.
Renewables in 2016 were again the fastest growing of all energy sources, rising 12%. Although providing still just 4% of total primary energy, the growth represented almost a third of the total growth in energy demand during the year. In contrast, use of coal—the most carbon-intensive of the fossil fuels—fell steeply for a second straight year, down 1.7%, primarily due to falling demand from both the US and China.
The combination of weak energy demand growth and the shifting fuel mix meant that global carbon emissions are estimated to have grown only 0.1%, making 2016 the third consecutive year of flat or falling emissions, the review indicated. This marks the lowest 3-year average for emissions growth since 1981-83.
“While welcome, it is not yet clear how much of this break from the past is structural and will persist,” commented Bob Dudley, BP Group chief executive. “We need to keep up our focus and efforts on reducing carbon emissions. BP supports the aims set out in the COP21 Paris meetings and is committed to playing our part to help achieve them.”


