BP: Oil gained global market share in 2015 for first time in 16 years
Although crude oil prices in 2015 recorded their largest annual decline on record in dollar terms and their largest percentage decline since 1986, oil gained market share for the first time since 1999, according to the 65th edition of BP PLC's Statistical Review of World Energy.
The multinational firm’s comprehensive review of energy markets notes that prices for all fossil fuels declined last year, prompting adjustments in the energy markets. In some markets, demand was lifted while curtailing supply and shifting the fuel mix in others.
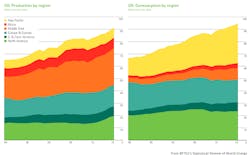
Oil remained the world’s leading fuel, accounting for 32.9% of global energy consumption. Global oil consumption grew 1.9 million b/d, or 1.9%, nearly double the recent historical average of 1% and significantly stronger than the increase of 1.1 million b/d seen in 2014.
The relative strength of consumption was driven by countries in the Organization for Economic Cooperation and Development, where consumption increased 1.1%, compared with an average decline of 1.1% over the past decade. Growth was well above recent historical averages in the US at 1.6% and the European Union at 1.5%. Down 3.9%, Japan recorded the largest decline in oil consumption.
Outside of the OECD, net oil importing countries recorded significant increases. Up 6.3%, China once again accounted for the largest increment to demand, while India, rising 8.1%, surpassed Japan as the world’s third-largest oil consumer. But this was offset by slower growth in oil producers such that oil demand growth in the non-OECD as a whole, up 2.6%, was below its recent historical average.
Global oil production increased even more rapidly than consumption for a second consecutive year, rising 2.8 million b/d, the strongest growth since 2004. Production in Iraq, up 750,000 b/d, and Saudi Arabia, up 510,000 b/d, rose to record levels, driving an increase in production from the Organization of Petroleum Exporting Countries of 1.6 million b/d to 38.2 million b/d, exceeding the previous record reached in 2012.
Non-OPEC production slowed from last year’s record growth but still rose 1.3 million b/d. Up 1 million b/d, the US had the world’s largest annual growth increment and remained the world’s largest oil producer. Elsewhere, production growth in Brazil, Russia, the UK, and Canada was offset by declines in Mexico, Yemen, and elsewhere.
Global proved oil reserves in 2015 fell 2.4 billion bbl to 1,697.6 billion bbl, just the second annual decline in BP’s data set. Reserves have nonetheless increased 320 billion bbl over the past decade and are sufficient to meet 50.7 years of global production. Brazil recorded the largest decline, with proved reserves falling 3.2 billion bbl, while Norwegian proved reserves increased 1.5 billion bbl.
OPEC member countries continue to hold the largest share of global proved reserves at 71.4%. On a regional basis, South and Central American reserves have the highest reserves-to-production ratio at 117 years.
Gas consumption growth rises
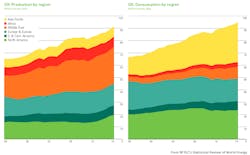
World natural gas consumption in 2015 grew 1.7%, a significant increase from the very weak growth, 0.6%, seen in 2014 but still below the 10-year average of 2.3%. As with oil, consumption growth was below average outside the OECD at 1.9%, accounting for 53.5% of global consumption, but above average in the OECD countries at 1.5%.
Among emerging economies, Iran and China—up 6.2% and 4.7%, respectively—recorded the largest increments to consumption, even though growth in China was sluggish compared with a 10-year average growth of 15.1%. Meanwhile, falling 5%, Russia recorded the largest volumetric decline, followed by Ukraine at 21.8%. Among OECD countries, the US, rising 3%, accounted for the largest growth increment. Gaining 4.6%, EU consumption rebounded after a large decline in 2014.
Globally, gas accounted for 23.8% of primary energy consumption. Global gas production grew 2.2%, more rapidly than consumption but below its 10-year average of 2.4%. As with consumption, the US, up 5.4%, recorded the largest growth increment, with Iran, up 5.7%, and Norway, up 7.7%, also recording significant output increases.
Growth was above average in North America, Africa, and the Asia-Pacific region. EU production once again fell sharply at 8%, with the Netherlands recording the world’s largest decline with a 22.8% dive. Large volumetric declines were also seen in Russia and Yemen, losing 1.5% and 71.5%, respectively.
Global gas trade rebounded in 2015, rising 3.3%. Pipeline shipments increased 4% driven by growth in net pipeline exports from Russia and Norway, gaining 7.7% and 7%, respectively. The largest volumetric increases in net pipeline imports were in Mexico and France, respectively rising 44.9% and 28.8%. Global LNG trade increased 1.8%.
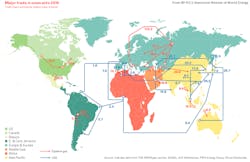
Export growth was led by Australia, up 25.3%, and Papua New Guinea, up 104.8%; offsetting declines in shipments from Yemen, down 77.2%. Higher net LNG imports for Europe, up 15.9%, and rising Middle Eastern imports, up 93.8%, were partly offset by declines in net imports in South Korea and Japan, down 10.4% and 4%, respectively. International gas trade accounted for 30.1% of global consumption; the pipeline share of global gas trade rose to 67.5%.
As was the case for oil, global proved gas reserves in 2015 fell slightly by 100 billion cu m to 186.9 trillion cu m, sufficient to meet 52.8 years of current production. Small declines in Russian and Norwegian reserves drove the decline. Reserves have increased 29.6 trillion cu m over the past decade. The Middle East region holds the largest proved reserves at 80 trillion cu m, 42.8% of the global total, and has the highest regional reserves-to-production ratio at 129.5 years.
Global emissions of carbon dioxide from energy consumption increased only 0.1% in 2015, driven by a combination of slightly slower energy consumption growth and a shift in the global fuel mix. Other than the recession of 2009, this represented the lowest growth rate since 1992.
Emissions growth was below average in every region except Europe and Eurasia. The US, down 2.6%, and Russia, down 4.2%, accounted for the largest absolute declines in emissions, while India, up 5.3%, saw the largest increase. Chinese emissions declined for the first time since 1998.