Decommissioning activity forecast high for Gulf of Mexico
Mark J Kaiser
Center for Energy Studies
Louisiana State University
Baton Rouge
A midyear update on decommissioning activity in the Outer Continental Shelf of the Gulf of Mexico provides early evidence that 2011 will have a record number of well abandonments and above average number of structure removals.
For the first 6 months of 2011, the petroleum industry abandoned 671 wells and removed 62 structures from the OCS. If current trends persist, we expect the abandonment of 1,200-1,500 wells and removal of 220-280 structures by yearend.
Decommissioning in the OCS has accelerated in recent years in response to notice to lessees and operators (NTL 2010-G05) requirements (see box on next page) that specify strict time lines for abandoning wells and structures that have not produced for 5 years or more.
Operators have 3 years from Oct. 15, 2010, to plug and abandon idle wellbores and 5 years to remove idle structures.
Abandonment activity
Well abandonments in exploration, production, and decommissioning operations are done from mobile offshore drilling units, platform-based rigs, lift boats, and related service vessels.
Abandonments take place throughout the year and for many different reasons, such as successful and unsuccessful exploration, temporary or permanent cessation of production, preparation for decommissioning, regulatory requirements, and cleanup associated with hurricane destruction. Historically, most wells are abandoned during the summer season and the least amount of activity occurs during the winter months.
Well abandonments are classified as temporary or permanent depending on the final status of the wellbore.
In temporary abandonment (TA), all completed intervals are rendered incapable of production either by squeezing the zones or by isolation, but the conductor surrounding the wellbore is not pulled.
In a permanent abandonment (PA), after removal of all tubing and equipment from the well, all producing intervals are cemented in accordance with regulatory requirements, and the conductor is cut 15 ft below the mud line and removed.
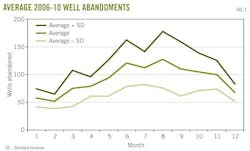
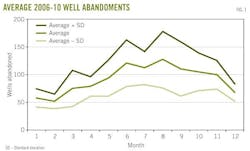
Fig. 1 shows the average number of PA and TA wells during 2006-10 and the standard deviation band to indicate historic variability. The interval range varies with the number of abandonments and generally increases with activity.
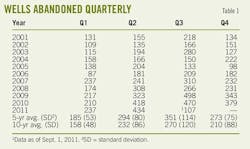
Table 1 shows the number of wells abandoned by quarter.
The OCS had more wells abandoned in 2009 and 2010 than at any time in the past. Total abandoned were 1,381 wells in 2009 followed by 1,477 wells in 2010.
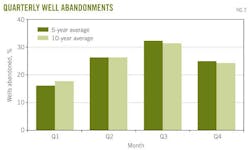
Fig. 2 shows the percent of well abandonments by quarter. Most activity occurs during third quarter (July-September) and the least in first quarter (January-March).
If activity during the year were uniform, each quarter would have the same number of abandonments. Observe that the third-quarter abandonments mostly are pulled from the first quarter.
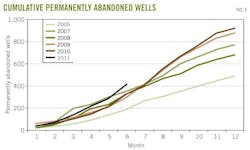
Figs. 3 and 4 show the cumulative PA and TA well trends from 2006 to 2010. The cumulative curve flattens if there is low activity for 1 or more months, but that is infrequent, indicating continuous activity throughout the year. TA activity is somewhat more uniform compared with the PA activity.
The first 6 months of 2011 saw 671 wells abandoned. The PA activity trends above historic numbers, while TA activity currently tracks the 2009 levels.
Displaying 1/4 Page1, 2, 3, 4Next>
View Article as Single page
