Decommissioning activity forecast high for Gulf of Mexico
Mark J Kaiser
Center for Energy Studies
Louisiana State University
Baton Rouge
A midyear update on decommissioning activity in the Outer Continental Shelf of the Gulf of Mexico provides early evidence that 2011 will have a record number of well abandonments and above average number of structure removals.
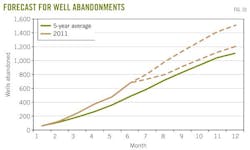
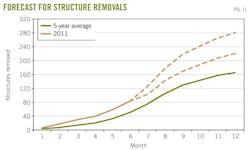
For the first 6 months of 2011, the petroleum industry abandoned 671 wells and removed 62 structures from the OCS. If current trends persist, we expect the abandonment of 1,200-1,500 wells and removal of 220-280 structures by yearend.
Decommissioning in the OCS has accelerated in recent years in response to notice to lessees and operators (NTL 2010-G05) requirements (see box on next page) that specify strict time lines for abandoning wells and structures that have not produced for 5 years or more.
NTL NO. 2010-G05The Bureau of Ocean Energy Management, Regulation and Enforcement (BOEMRE) issued new guidelines and measures in a notice to lessees and operators (NTL 2010-G05) for decommissioning idle wells and structures on active leases in the OCS Gulf of Mexico with an effective date of Oct. 15, 2010. The purpose of NTL No. 2010-G05 is to "establish guidelines that provide a consistent and systematic approach to determine the future utility of idle infrastructure on active leases and to ensure that all wells, structures, and pipelines on terminated leases, and pipelines on terminated pipeline rights-of-way (ROW) are decommissioned within the time frames established by regulations, conditions of approval, and lease instruments." Well classificationThe guidelines specify three classes of wells: wells on expired leases, wells that pose a hazard, and wells on active leases. Wells on expired leases and wells that pose a hazard are defined similar to previous regulations. For wells on expired leases, an operator has 1 year after the lease terminates to permanently plug all wells. For a well that poses a hazard to safety or the environment, operators are required to submit an Application for Permit to Modify and to permanently plug the wellbore within 30 days after identifying the hazard. No longer useful wells, platformsWells on active leases form a new category and are defined as no longer useful for operations and no longer capable of producing in paying quantities. BOEMRE defines a well as no longer useful for operations if: • The well has not been used in the past 5 years for operations associated with exploration and production or as infrastructure to support such operations. • No plans exist for operations associated with exploration and production or infrastructure to support such operations. BOEMRE defines a platform as no longer useful for operations if the platform: • Has been toppled or otherwise destroyed. • Has not been used in the past 5 years for operations associated with exploration and production or as infrastructure to support such operations. Production in paying quantitiesBOEMRE defines producing in paying quantities as production that "yields a positive stream of income after subtracting normal expenses (i.e., operating costs), which include the sum of minimum royalty or actual royalty payments, whichever is greater, and the direct lease operating costs." Wells on active leasesFor any well that has not produced for 5 years or more and can no longer produce in paying quantities, the operator within 3 years after the effective date must: • Permanently plug the well. • Temporarily abandon the well. • Provide the well with downhole zonal isolation and within 2 years either permanently plug or temporarily abandon the well. For wells that have not been used in the past 5 years that are believed to be useful for operations or capable of future production, operators can submit to the regional supervisor field operations supporting documentation of the well's usefulness for further consideration. PlatformsAn operator with a platform or other facility associated with a terminated lease, right-of-use and easement, or pipeline right-of-way has 1 year after the termination date to remove the platform. For a platform or other structure that is not being used for exploration and production operations or as infrastructure to support such operations, the operator must remove the platform within 5 years after the effective date of the NTL or within 5 years of the platform meeting the definition of no longer useful for operations, whichever is later. |
Operators have 3 years from Oct. 15, 2010, to plug and abandon idle wellbores and 5 years to remove idle structures.
Abandonment activity
Well abandonments in exploration, production, and decommissioning operations are done from mobile offshore drilling units, platform-based rigs, lift boats, and related service vessels.
Abandonments take place throughout the year and for many different reasons, such as successful and unsuccessful exploration, temporary or permanent cessation of production, preparation for decommissioning, regulatory requirements, and cleanup associated with hurricane destruction. Historically, most wells are abandoned during the summer season and the least amount of activity occurs during the winter months.
Well abandonments are classified as temporary or permanent depending on the final status of the wellbore.
In temporary abandonment (TA), all completed intervals are rendered incapable of production either by squeezing the zones or by isolation, but the conductor surrounding the wellbore is not pulled.
In a permanent abandonment (PA), after removal of all tubing and equipment from the well, all producing intervals are cemented in accordance with regulatory requirements, and the conductor is cut 15 ft below the mud line and removed.
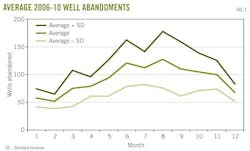
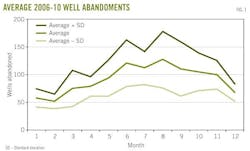
Fig. 1 shows the average number of PA and TA wells during 2006-10 and the standard deviation band to indicate historic variability. The interval range varies with the number of abandonments and generally increases with activity.
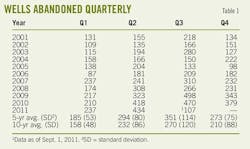
Table 1 shows the number of wells abandoned by quarter.
The OCS had more wells abandoned in 2009 and 2010 than at any time in the past. Total abandoned were 1,381 wells in 2009 followed by 1,477 wells in 2010.
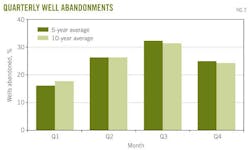
Fig. 2 shows the percent of well abandonments by quarter. Most activity occurs during third quarter (July-September) and the least in first quarter (January-March).
If activity during the year were uniform, each quarter would have the same number of abandonments. Observe that the third-quarter abandonments mostly are pulled from the first quarter.
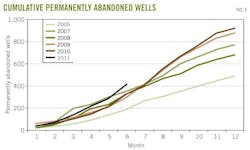
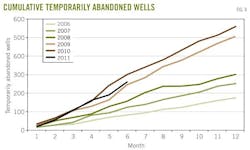
Figs. 3 and 4 show the cumulative PA and TA well trends from 2006 to 2010. The cumulative curve flattens if there is low activity for 1 or more months, but that is infrequent, indicating continuous activity throughout the year. TA activity is somewhat more uniform compared with the PA activity.
The first 6 months of 2011 saw 671 wells abandoned. The PA activity trends above historic numbers, while TA activity currently tracks the 2009 levels.
Structure removals
Structures are removed during decommissioning and when destroyed by hurricanes. Before structure removal, all wells must be abandoned permanently and pipelines detached and decommissioned in accord with regulatory guidelines. TA wells must be brought into PA status or provided an exemption.
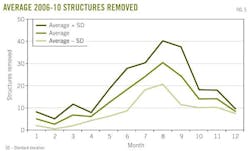
Removal activity exhibits a strong seasonal component. Most work is done during the summer when favorable operating conditions prevail and service contractors can schedule activity between installation and related work (Fig. 5).
The number of structures removed during the past 5 years has ranged from 107 to 222. In 2009 and 2010, 222 and 196 structures were removed, the highest numbers ever recorded. In the first 6 months of 2011, 83 structures were decommissioned.
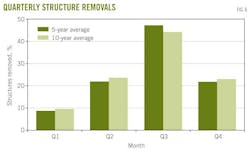
Activity levels generally are lowest from January through March, pick up in the second quarter, and reach peak levels during the summer before the winter season approaches (Fig. 6). Third-quarter activity is responsible for almost half the work performed during the year and is more than twice spring and fall activity combined. If a major disruption occurs during summer, service companies have a difficult time to recover.
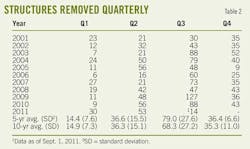
During the last 5 years, the third quarter averaged 79 structure removals compared with 36 removals each during the second and fourth quarters and 14 removals in the first quarter (Table 2).
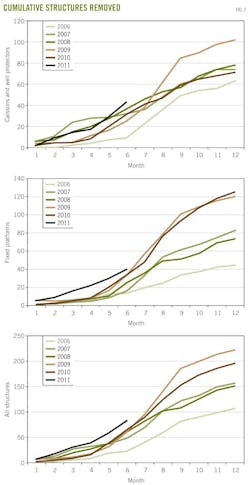
Fig. 7 illustrates the structure removal trends for caissons and fixed platforms. Compared with the straight lines observed for well abandonments, S-shaped curves are common, reflecting the large midseason increase in activity between July and September.
2011 activity forecast
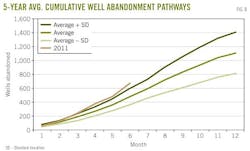
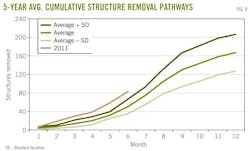
Figs 8 and 9 show the cumulative well abandonment and structure removal trends in 2011 relative to the 5-year average and standard deviation interval.
The interval range is calculated in terms of the cumulative activity and increases along the curve.
Well abandonments during the first 6 months of 2011 exceeded the 5-year average trend line and currently are in the upper interval of historic levels. If the current trend persists, we would expect the abandonment of more than 1,200-1,500 wells by yearend (Fig. 10).
Structure removals are outpacing the 5-year average and if current trends persist, we would expect the removal of 220-280 structures in 2011 (Fig. 11).
A more formal approach for estimating yearend activity is to prorate quarterly data.
Historic trends indicate 43% of well abandonments and 31% of removal activity is performed in the first two quarters of the year, so that we would expect 671/0.43 = 1,560 well abandonments and 83/0.31 = 268 structure removals in 2011.
We can account for underreporting (see box on time lag) through an adjustment factor. The level of underreporting at any point in time is unknown. However, the closer the period between the time of evaluation and the time of the assessment, the more uncertain are the reported data.
Time lag
Decommissioning statistics frequently exhibit wide variation when reported in the trade press and in industry presentations. The lack of well-defined categories and the experience of the analyst are the primary reasons for most discrepancies, but another culprit not often mentioned is the time during the year when the analysis is performed. A time lag always exists between the operation and the recording of the final data and its availability to the public. This time lag can lead to significant differences in the numbers prepared.
Companies submit paperwork to BOEMRE within 1 month after completing the decommissioning operations, and several additional weeks will pass before BOEMRE processes and electronically records the reports.
If companies submit incomplete or inconsistent entries, the reports may be sent back for revision and resubmission that will further delay data recording.
BOEMRE updates the decommissioning databases continually but does not archive them. It does not flag entries as to whether a data element was changed or provide the date when the entry was recorded, so that time passes before the elements stabilize.
The completeness of the public records depends on the length of time from the period of interest. The shorter the time, the more uncertain is the data. Likewise, longer times provide more certain data.
For example, on Sept. 15, 2011, data compiled for third-quarter well abandonments will be incomplete, second-quarter data will be underreported, and first-quarter data should be reasonably complete and stable.
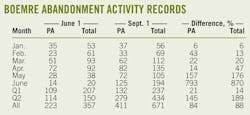
The table above shows the effect of time lag using well abandonment data compiled on July 1 and Sept. 1, 2011. On July 1, reported January well abandonments were 53, while on Sept. 1, they were 56, a 6% difference. Reported April well abandonments were 92 on July 15 and 135 on Sept. 1, a 47% difference.
We expect that differences across time will diminish the further away from the time of interest. The closer to the time of evaluation, the more incomplete and uncertain is the data.
Well abandonment data are assumed complete at the time of the analysis on Sept. 15.
If second quarter structure removal data are underreported by 10%, then 53(1.1) = 58 structures were abandoned in the quarter but not reported at the time of analysis. This would raise the yearend removals to 285.
The total number of well abandonments and structure removals will not be known with certainty until March 2012.
Manuscripts welcome Oil & Gas Journal welcomes for publication consideration manuscripts about exploration and development, drilling, production, pipelines, LNG, and processing (refining, petrochemicals, and gas processing). These may be highly technical in nature and appeal or they may be more analytical by way of examining oil and natural gas supply, demand, and markets. OGJ accepts exclusive articles as well as manuscripts adapted from oral and poster presentations. An Author Guide is available at www.ogj.com, click "home" then "Submit an article." Or, contact the Chief Technology Editor ([email protected]; 713/963-6230; or, fax 713/963-6282), Oil & Gas Journal, 1455 West Loop South, Suite 400, Houston TX 77027 USA. |
The author
More Oil & Gas Journal Current Issue Articles
More Oil & Gas Journal Archives Issue Articles
View Oil and Gas Articles on PennEnergy.com
