A healthy US economy will bring limited growth to energy demand in 2006, as crude oil, natural gas, and petroleum product prices ease from record-setting highs.
Demand for most sources of energy will grow, with the exception of renewable energy, following a year in which energy demand was little changed.
Oil product demand growth, which was nil in 2005, will be small at less than 2%, and natural gas demand will grow by an even smaller rate.
US crude and condensate production, which suffered after a record-setting and destructive Atlantic hurricane season, will not fully rebound to 2004 levels, and imports will increase again this year.
Similarly, natural gas production will increase from last year’s decline, but it will still be down from 2004 production. Offshore gas production will see the biggest recovery this year.
After operating at a reduced rate in the final 4 months of last year, refining activity in the US will continue to recover from hurricane damage. OGJ expects refining capacity utilization this year to average about the same as for 2005.
US economy, energy use
OGJ’s 2006 energy forecast is based on the assumption that the continually expanding US economy will require additional energy. Economic growth this year, as measured by gross national product, will be about 3.7%, down from last year’s 4% growth.
Rising interest rates will hold economic growth in check this year. The Federal Open Market Committee last year raised the federal funds rate eight times, each time by 25 basis points, pushing the rate to 4.25% by the end of 2005.
Personal consumption expenditures, equipment and software, federal government spending, and residential fixed investment drove the economy last year, according to the US Bureau of Economic Analysis (BEA).
Recent figures from BEA also show that personal disposable income increased in November 2005 from the prior month mostly due to large decreases in energy prices. This trend should continue in 2006.
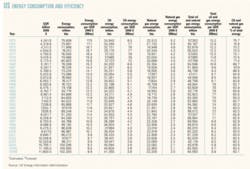
OGJ forecasts that US energy consumption will climb 1.3% this year. In 2005, energy demand increased just 0.7%, with high prices aiding efficiency gains.
With a record-breaking hurricane season, blistering heat waves, lingering drought, and a crippling Northeast blizzard, the National Oceanic & Atmospheric Administration reported last month that based on preliminary data the 2005 annual average temperature for the contiguous US likely will be 1° F. (0.6° C.) above the 1895-2004 mean, which will make 2005 one of the 20 warmest years on record for the US.
Energy demand by source
Total US energy demand will be 102.3 quadrillion btu (quads) this year.
Oil will remain the dominant energy source, holding more than 40% of the market, while natural gas and coal gain by smaller margins and claim identical shares of the energy mix. Nuclear energy use will rebound a bit from last year’s decline, and the use of hydroelectric power and other renewable energy sources will be unchanged from last year.
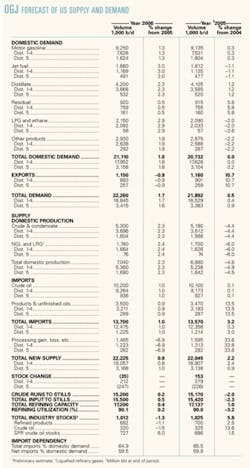
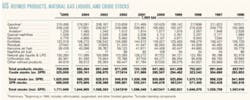
Demand for oil products will grow 1.8% following a year of no growth. US oil product use held steady at 40.6 quads in 2004 and 2005. Jet fuel and distillate demand will lead oil product demand growth this year, but demand for motor gasoline and other products will climb as well.
Natural gas demand will increase a little more than 1% this year, elevating gas demand to almost 23% of the US energy market. Warm summer weather and slightly lower gas prices will offset milder than normal winters to nudge demand upward following last year’s 0.6% decline.
US coal demand will move up, too, but by less than in 2005. Demand for coal, which has been steadily rising in the electric power sector while trending lower in the industrial sector, will be up 1.1% this year to total 23.25 quads. A year ago, coal demand gained 2.7%, helped by higher oil and gas prices, although coal prices have been rising as well.
OGJ forecasts that nuclear demand will rebound by 1.2% this year to 8.2 quads. This will represent 8% of the energy mix in the US. The number of operable nuclear units in the US remains 104.
Nuclear energy consumption declined 1.6% last year after setting a record in 2004. Nuclear energy generated 788.5 million kw-hr of electricity net generation, or 19.9% of the US total, in 2004.
Demand for hydroelectric power and other renewable energy sources will be unchanged at 6.3 quads and will continue to hold the smallest share of the US energy market at just 6.2%.
Last year demand for all renewables jumped 5%, with the biggest increase for conventional hydroelectric power generation, which is also the most consumed renewable. Wood is the second largest source of renewable energy in the US, followed by waste, geothermal, alcohol fuels, wind, and solar.
Oil supply
US liquids production will rebound somewhat from last year’s fall, but another busy-yet less destructive-hurricane season will prevent full recovery.
Product imports and releases from the US Strategic Petroleum Reserve made up the difference in oil supply last year in the wake of production losses due to Hurricanes Katrina, Rita, and Wilma.
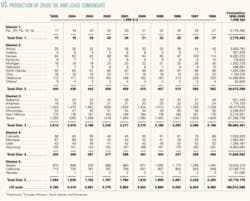
OGJ estimates that US crude and condensate production averaged 5.18 million b/d last year, down 4.4% from a year earlier, with declines in almost all producing states.
Louisiana production of crude and condensate slipped to average 1.3 million b/d last year from 1.47 million in 2004, and from 1.56 million b/d in 2003. Similarly, oil output in Texas last year averaged 1.25 million b/d vs. 1.29 million b/d a year earlier and 1.36 million b/d in 2003.
Alaskan crude and condensate production continued to decline, sinking last year to average an estimated 870,000 b/d, down from 908,000 b/d in 2004. The most recent year in which Alaskan output increased was 2002, when production averaged 988,000 b/d.
Crude and condensate production gained 28% in Montana last year to average 87,000 b/d, and North Dakota’s oil production increased about 8% to 92,000 b/d.
Inventories
OGJ expects commercial stocks of crude and products to dip this year. But the Strategic Petroleum Reserve will finally reach capacity of 727 million bbl.
Plans to refill the SPR to capacity were delayed last year following the emergency release of crude in the aftermath of Hurricane Katrina. At the end of 2005, the SPR held 686 million bbl of crude.
Industry stocks of crude ended last year at 325 million bbl, up from 286 million bbl a year earlier, while product stocks climbed to 700 million bbl from 683 million bbl.
Commercial inventories of crude will decline 1.5% this year, and oil product stocks will shrink 1.1% from yearend 2005 levels.
Oil imports
Total US imports of crude and products will grow 1% this year. This compares to a 3.8% hike in total imports during 2005.
Product imports this year will average 3.5 million b/d, up from 3.47 million b/d last year and 3.07 million b/d in 2004. And OGJ expects that crude imports will reach 10.2 million b/d vs. 10.1 million b/d last year.
In 2005, product imports grew 13.2%, as US Gulf Coast refiners recovered from direct hurricane hits. Especially strong compared with a year earlier were gasoline, diesel, and residual fuel oil imports.
Through the first 11 months of 2005, resid imports were up more than 22% from the same year-earlier period, according to the American Petroleum Institute. The leading sources of US product imports last year were Canada, the US Virgin Islands, and Venezuela.
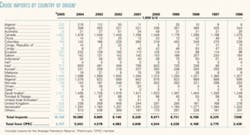
US crude imports increased 0.9% from 2004, and the leading sources of those imports stayed the same. Canada again was the biggest supplier of US crude imports, averaging 1.68 million b/d. The second leading source of crude imported by the US last year was Mexico, followed by Saudi Arabia, Venezuela, and Nigeria.
Refining, prices
With refineries along the gulf coast still vulnerable to tropical storms this year, OGJ forecasts that refining inputs will only bounce back by small margins for 2006.
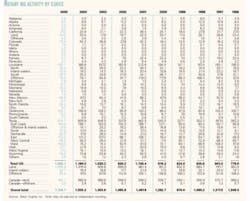
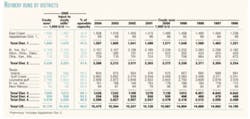
Total inputs to US refineries in 2005 dropped an estimated 2.3% from a year earlier, as more than 1 million b/d of refining capacity remained offline or running at reduced rates at the end of the year.
OGJ forecasts that refining capacity will average 17.2 million b/d this year, and utilization will be nearly the same as last year’s. Average 2005 refining capacity in the US was 17.14 million b/d, and for the year, average capacity utilization was 90%. In 2004, refinery utilization in the US was 93%.
Costs of both light and heavy crudes increased last year, but refining margins were buoyed by healthy retail prices.
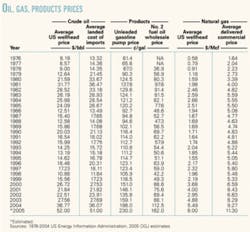
The average US refiner acquisition cost of crude last year was an estimated $53.15/bbl for US crude, up from the 2004 average cost of $38.97/bbl. And for imported crude, the average cost for refiners last year was an estimated $49.15/bbl, up from $35.79/bbl a year earlier.
OGJ estimates that the average pump price for unleaded gasoline in the US was $2.30/gal last year. In 2004, the pump price averaged $1.88/gal, up from $1.59/gal in 2003.
The US Gulf Coast cash refining margin through the first 11 months of 2005 averaged $13.01/bbl. For all of 2004, this margin averaged $6.50/bbl, according to Muse, Stancil & Co.
Margins also posted large gains for refiners on the West and East coasts as well as in the Midwest. Outside the US, refiners didn’t enjoy these surges. Average refining margin gains last year in Northwest Europe and Southeast Asia were much more modest, gaining about 13% and 10% respectively.
Oil demand
US oil product demand will increase almost 2% this year, following a year of no growth. OGJ estimates that demand for all oil products will increase by small margins, with jet fuel demand growth the strongest.
A hearty US appetite for transportation fuels, in addition to products for construction and petrochemical production, will revive petroleum products demand this year. In 2005, some products, such as jet fuel, experienced declines in demand, but motor gasoline demand was unchanged from 2004.
Total US demand for oil products in 2006 will average 21.1 million b/d. Exports will decline by less than 1% to 1.15 million b/d, following an increase of more than 10% last year.
Demand for oil products used in the US and those exported from the US will combine to total 22.26 million b/d, up from 21.89 million b/d last year.
Jet fuel
OGJ forecasts that jet fuel demand will rebound this year to 1.66 million b/d. It declined in 2005 to an estimated 1.61 million b/d from an average of 1.63 million b/d a year earlier.
Through July 2005, jet fuel consumption was little changed from the previous year, then demand began to sink. Average jet fuel use was 1.65 million b/d during August 2005, down from 1.73 million b/d for August 2004.
Yet US airlines carried 5.3% more domestic passengers and flew 1.2% more domestic flights during the first 9 months of 2005 than they did during the same period in 2004, the US Department of Transportation’s Bureau of Transportation Statistics (BTS) reported.
BTS also reported that during the first 9 months of last year, airlines operated 7.65 million flights, up from the 7.55 million flights operated in the same 2004 period.
Motor gasoline
US demand for motor gasoline will average 9.25 million b/d, up 1.3%.
In the first 8 months of last year, gasoline demand was mostly unchanged from 2004, and then high prices suppressed demand in September and October. Demand began to rebuild in November with a drop in pump prices.
US pump prices for gasoline last year peaked in September, when refining capacity was affected by hurricane damage. The average US pump price for regular unleaded gasoline was $2.93/gal that month, compared with $1.89/gal for September 2004.
For November 2005, the average regular unleaded pump price averaged $2.34/gal.
Distillate
Distillate demand will average 4.2 million b/d this year, a gain of 2.3%.
Demand for distillate, which is used mostly as heating oil and transportation fuels, edged up last year to an average of 4.11 million b/d from 4.06 million b/d a year earlier.
Demand for high-sulfur distillate, typically used as heating oil, was down last year as a result of mild weather and high prices. OGJ estimates that the price of No. 2 fuel oil last year averaged $1.62/gal, up from the 2004 average of $1.125/gal.
Residual fuel oil
OGJ is forecasting that the smallest demand growth rate among major petroleum products will be for residual fuel oil at just 0.5%. This will follow a year of strong growth in 2005. Much of the slowing growth this year will be due to moderating natural gas prices.
In 2005, demand for resid jumped 5.8% to average 915,000 b/d, mostly as a result of high natural gas prices. Although the number of industrial and electric utility facilities with the ability to switch fuels to resid from natural gas is diminishing, they appear to have driven resid demand growth last year.
EIA reports that for the month of September 2005, the average refiner price of resid for end users, excluding taxes, was $1.25/gal. For the same month a year earlier, the price of resid was $0.775/gal. Still, natural gas was selling at a 38% premium to resid in October, according to API.
Other products
Petrochemical production and construction spending, bolstering demand for all other petroleum products, will rebound from last year’s 2% decline.
Production of these products-which include LPG, ethane, gasoline blending components, and unfinished oils-dropped last year following hurricane damage to refineries and gas processing facilities.
OGJ expects that demand for LPG and ethane will increase nearly 3% this year to 2.15 million b/d, and demand for all remaining products will grow about 2% to 2.93 million b/d.
Natural gas
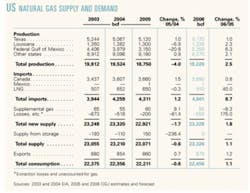
A small increase in US natural gas demand will be met with an uptick in US production and a 40% surge in LNG imports. OGJ forecasts that gas demand will total 22.5 tcf this year.
In 2005, gas demand-especially in the industrial sector-dipped as a result of high prices. Residential gas demand was down just slightly from 2004, but early estimates indicate a rebound in gas consumption last year in the electric power sector, which includes electric utilities and independent power producers.
The average delivered commercial price of gas is estimated to have been $11.30/Mcf last year, up from $9.27/Mcf a year earlier, while the wellhead gas price climbed to average $8/Mcf from the 2004 average of $5.49/Mcf.
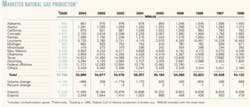
OGJ forecasts that this year will see a slightly less active hurricane season affecting the Gulf of Mexico and the states along the Gulf Coast and that US production can rebound a bit from last year’s 4% decline. Production in the major gas producing regions-Texas, Louisiana, and the federal offshore area-will increase this year.
Last year, declines in Louisiana, Mississippi, New Mexico, Oklahoma, Alabama, Florida, Kansas, and federal offshore areas offset gas production increases in Alaska, Colorado, Montana, Texas, Utah, and Wyoming.
In 2005, there was a big jump in the number of exploratory and development gas wells drilled in the US. Preliminary EIA figures show a jump of more than 20% from such activity during 2004.
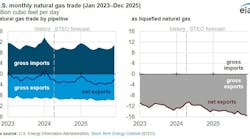
US gas imports will grow nearly 7% this year because of LNG, as additional liquefaction capacity comes online.
Atlantic LNG Co. of Trinidad & Tobago last month began production from Train IV at its Port Fortin natural gas liquefaction plant in Trinidad and Tobago (OGJ Online, Dec. 19, 2005). This train is devoted to liquefying gas for the US market.
Liquefaction start-up delays, output reductions, and demand for LNG in Europe, especially in the UK, combined to suppress US imports of LNG last year.
OGJ estimates that US LNG imports totaled 650 bcf last year, down from 652 bcf a year earlier. An increase in imports from Egypt was unable to offset reduced import volumes from most other source countries, including Algeria, Australia, Malaysia, Oman, and Qatar.
Imports of pipeline gas from Canada in 2006 will move up to 3.69 tcf from 3.66 tcf last year, and such imports from Mexico will remain low at just 1 tcf for the year. Demand for gas in Mexico resulted in the absence of imports from that country as recently as 2003 and 2004.
OGJ forecasts that US exports of gas will increase just over 1% to 870 bcf. Last year, exports to Canada moved up just slightly from such volumes in 2004, while exports to Mexico declined more than 10%.
US exports of LNG to Japan through October 2005 increased to 54 bcf from 51 bcf a year earlier, according to the latest figures available from EIA at presstime.✦


