Early new field production estimation could assist in quantifying supply trends
Rafael Sandrea, IPC, Tulsa
A severe slump in the global E&P industry in 1998-99 saw oil prices bottoming at $10/bbl, the lowest in 27 years, US drilling levels hitting their lowest point in 66 years, and global spending on E&P dropping 30% to $110 billion.1
As oil prices picked up from $18/bbl in June 1999 to $27 in January 2000, and US drilling grew 46%, E&P capital spending built up steadily reaching an all-time high of $200 billion in 2005.
Kazakhstan discovered oil offshore for the first time at Kashagan field with reserves estimated in 11.6 billion bbl. This is the largest field discovered anywhere in a single year since 1991.
Iran made a big oil discovery, Azadegan field, with reported reserves of 5 billion bbl.
Offshore West Africa, especially Angola and Nigeria, turns out to be one of the world’s new great hydrocarbon areas.
Over the last 7 years some 140 new oil fields ranging in size from 11.6 billion bbl to 50 million bbl recoverable have been discovered worldwide. They contain a total of 85 billion bbl of recoverable reserves, with a production potential of roughly 15 million b/d.
Of these new fields, 127 are offshore and 53 are deepwater fields. Only 13 were discovered onshore, many of which are in remote areas.
In general, both offshore and onshore regions are characterized by complex environmental constraints and limited opportunities for acquiring reservoir and well production potential data. A deepwater well may cost upwards of $100 million!
After drilling a successful exploratory well, depending on the probable size of the find, one or two additional exploratory and one or two appraisal wells are drilled for extended well testing. Sophisticated visualization/interpretation software allows borehole calibration of seismic volumes for prediction of lithology, porosity, and fluid connectivity between wells.
These data are essential to obtain a comprehensive production evaluation before a development plan for the field can be made. The evaluation period can take 2 to 5 years or more from the time of discovery.
Currently, 105 of the 140 new fields are still under development or in the planning stage. Only 35 fields with a combined potential of 3 million b/d are on production.
Consequently, it is of paramount interest to have available an early estimate of the production potential a new field discovery can put forward. This threshold is vital to supply analysts and for the design of production facilities.
The objective of this article is to develop an algorithm that would provide an early estimate of the production potential of newly discovered oil fields.
Based on the logistic equation that has proven to successfully replicate the production behavior of both oil2 and gas3 fields, the early model is developed using field performance data from eight mature major oil fields around the world.
These fields typify a broad spectrum of production characteristics: onshore, deepwater, heavy and light oils, and size variations from 15 billion bbl to 700 million bbl.
The model is then used to predict the production potential of 18 new, world-class oil fields that have recently been put on stream or are scheduled to go on stream in the near term.4 The predicted production potential values are compared with those available from profiles of the fields made public by stakeholders’ disclosures.
A world-class oil field is defined as one containing 50 million bbl or more of recoverable reserves and having a production potential of 45,000 b/d and up.
Early model
The logistic equation is defined as follows:
dQ/dt = ro Q (1 - Q/K) (1)
where Q is the cumulative oil production, dQ/dt the annual production rate, ro the initial production growth rate, and K the reserves.
The production potential or peak production of an oil field occurs at the half-life (Q = 1⁄2K) of its recoverable reserves.
Solving Equation 1 for these conditions gives:
dQ/dt|peak≡ qmax = ro K / 4 (2)
Normally the parameters ro and K are established from extrapolation of the steady state decline plot of (dQ/dt)/Q vs. Q. For newly discovered oil fields, however, these parameters have to be established from other sources since there is no existing production history.
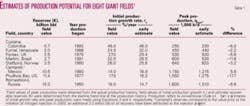
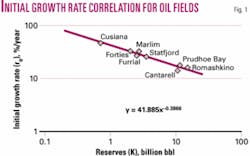
At the time of discovery, the recoverable reserves, K, would be the volumetric estimate of the geologic prospect discovered by the successful exploratory well. However, in order to estimate the initial production growth rate ro, it is necessary to establish a correlation between the parameters ro and K. This was accomplished using decline analysis to calculate the values of these two parameters for the eight sample fields (Table 1).
The correlation obtained is shown in Fig. 1. The least squares best-fit power regression is:
ro = 41.885 K-0.3866 (3)
This has a correlation coefficient of 0.972. Combining Equations 2 and 3 gives the early production potential model for new fields, namely:
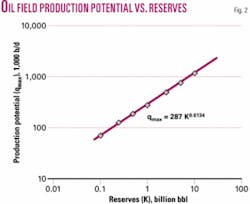
qmax = 287 K0.6134 (4)
where qmax is expressed in thousands of barrels per day (kb/d) and K is the volumetric estimate of the recoverable reserves in billions of barrels. A graphic solution of Equation 4 is shown in Fig. 2.
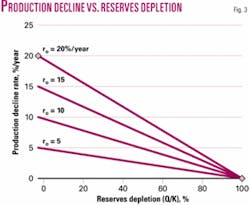
Another handy algorithm that defines the steady state decline trend line is:
D = ro (1 - Q/K) (5)
This provides a straightforward determination of D, the annual production decline rate of the field, as a function of its degree of reserves depletion, Q/K. Fig. 3 shows a universal plot of Equation 5.
null
Early model reliability
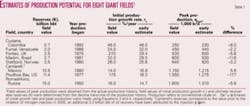
Table 1 summarizes the initial production growth rates and recoverable reserves values obtained using the decline curve technique (Equation 1) for the eight mature giant oil fields.
These values are termed field values since they were established with field production data. The calculated production potential values obtained with the early model, Equation 4, are then compared with the corresponding actual field peak production values.
The average deviation is 6.6%, with estimated values for individual fields varying between 2% and 18% from the field values. Only two fields had deviations above 8%.
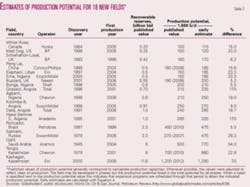
The early model was then applied to a mix of 18 new, world-class conventional oil fields (Table 2) that have recently been put on stream or will go on production in the next 6 years. They vary in size from 230 million bbl to 11.6 billion bbl of recoverable reserves; their total reserves are 35 billion bbl, which can sustain a production potential of 5.6 million b/d.
Two of the fields, Agbami and Kashagan, with a combined production potential of 1.4 million b/d, are yet to go on stream. Five of the fields currently on production will continue under development through 2010 in order to arrive at their full potential of 1.9 million b/d.
The 18 fields were selected to demonstrate the validity of the early algorithm in support of a wide variety of geological conditions over 12 countries. For example, Peng Lai (China), Elephant (Libya), and Erha (Nigeria) fields each has 500 million bbl of reserves that generate a field production potential of 150,000-160,000 b/d, a fine window of similarity.
The peak production potentials predicted by the early model must be compared with actual field behavior or with theoretical values obtained from dynamic reservoir studies. Since the fields are new, no true field production potential values are available per se.
Values from stakeholders’ public disclosures of field profiles and from other public sources were used as a basis of comparison. It should be pointed out, however, that these published values are more correctly nameplate capacities of the production facilities which are normally set at 10-15% below the field peak production potential. The object is to maintain a plateau-like production level over a prolonged period in order to optimize the investment.
With these considerations in mind, the peak potentials for the 18 selected oil fields were calculated using the early model. The results and comparisons with the known nameplate capacities are summarized in Table 2.
All of the early production potential estimates are higher than the corresponding nameplate capacities. This is as would be expected since the production facilities are designed at a lower capacity (10-15%) than the corresponding peak field production level. The average variation between the early estimates and the nameplate values for the 18 fields was 17.5%.
Peak potential as determined by the early algorithm, Equation 4, depends critically on the accuracy of the estimated value of the field’s reserves (K). The published reserves values for several (seven) of the fields are specific only to single digit accuracy, such as 0.5 billion bbl or 6 billion bbl. This level of precision can generate an intrinsic 5% deviation in the peak production values estimated with the early model.
When the early estimates were compared with the nameplate capacities for the 11 fields with double digit precision reserves values, the average deviation was reduced to 11.5%. This is well within the 10-15% design spread between nameplate capacities and field peak production values.
Final comments
The early model was developed to provide an estimate of the peak production potential of newly discovered oil fields. It is intended to be applied as soon as a wildcat is confirmed to be an oil discovery. Establishing the real potential of an oil field may take 2 to 5 years after discovery, following a costly appraisal drilling program.
The predictive algorithm, Equation 4, is simple and only requires a geologic approximation of the recoverable reserves of the target field at the time of discovery. It provides an estimate of field production potential, on average 11% higher than the so-called nameplate production capacity. The latter is a plateau rate normally set 10 to 15% below the true field peak potential. Consequently, the early model provides a sound estimate of a field’s peak production.
The early model is an effective tool for supply analysis; it is bidirectional in that it can predict production potential or reserves when only one of these two parameters is announced at the time of discovery, as sometimes occurs. In other cases, as when the field is developed in phases, the reserves being committed in each phase can be easily accounted for.
In the final analysis of supply trends, production capacity from newly discovered fields is only one component of the equation. New capacity is constantly being mitigated by natural depletion of the existing reserves.
Overall global depletion is presently just about 2.5%/year, which represents an annual loss of 1.8 million b/d of conventional crude oil production. The 2.5%/year value is obtained from Equation 5 for ro = 4.8%/year, K = 2,000 billion bbl, and Q2004 = 957 billion bbl. Analogous data for The Big Three: US (D = 1.0%/year for ro = 5.8%/year, K = 225 billion bbl, Q2004 = 185 billion bbl); Russia (D = 2.1%/year for ro = 9.4%/year, K = 195 billion bbl, Q2004 = 151 billion bbl); and Saudi Arabia (D = 2.7%/year for ro = 7.0%/year, K = 165 billion bbl, Q2004 = 101 billion bbl).
Worldwide production capacity going on stream from new oil field discoveries has averaged roughly 500,000 b/d/year in the last 7 years. Some 12 million b/d of new production capacity from 105 of the 140 oil fields discovered in the last 7 years is still awaiting development to go on stream.
There is a need for a fast track development plan. At current rates of project slippage, depletion will continue eating into discovery gains.
References
1. Sandrea, Ivan, and Aloshban, Ghassan, “Global E&P capital expenditure: trends and determinants,” Oil & Gas Financial Journal, Feb. 10, 2006.
2. Sandrea, Rafael, “What About Deffeyes’ Prediction that Oil Will Peak in 2005?,” Middle East Economic Survey, Vol. 48, No. 37, Sept. 12, 2005.
3. Sandrea, Rafael, “Global Natural Gas Reserves-A Heuristic Viewpoint,” Middle East Economic Survey, Vol. 49, No. 11, Mar. 13, 2006 (Part 1), Vol. 51, No. 12, Mar. 20, 2006 (Part 2).
4. Skrebowski, Chris, “Prices set firm, despite massive new capacity,” Petroleum Review, October 2005.
The author
Rafael Sandrea ([email protected]) is president of IPC, a Tulsa international petroleum consulting firm. Formerly, he was president and CEO of ITS Servicios Tecnicos, a Caracas engineering company he founded in 1974. He holds a PhD in petroleum engineering from Penn State University.
