Drillbit seismic images fractures of San Andreas fault system
Scientists recently used the drillbit seismic technique to image fractures and shear zones associated with the San Andreas fault near Parkfield, Calif. Low-level energy produced by the drillbit served as a downhole seismic source, and the wave response was measured by an array of geophones at the surface.
In the complex structural environment underlying Parkfield, numerous faults that comprise a flower structure are interpreted to cut the Cenozoic sedimentary cover and the Salinian block at the San Andreas Fault Observatory at Depth (SAFOD) project drillsite. Based on updated surface geologic maps by Rymer,1 these fractures and faults appear to trend subparallel to the San Andreas fault (SAF) and have been mapped up to 3 km to the southwest of the main trace of the SAF.2
Our study included the interpretation of a surface seismic profile and the drillbit seismic data. These data indicate that faulting is more abundant and shearing more pervasive as one approaches the main trace of the San Andreas fault. In addition, our interpretation of the locations and dips of faults in the PSINE profile correlates very well with locations and dips of several linear features imaged in the migrated drillbit seismic data.
Background
The San Andreas fault is the surface expression of one of the major plate tectonic boundaries of the Pacific plate that is exposed at the surface rather than submerged under the ocean. This fact has resulted in the fault becoming the primary focus of earthquake studies in the US.
The commencement of the SAFOD project began the most thorough examination of the San Andreas fault to date (OGJ, Sept. 20, 2004, p. 15). The motivation for the project encompasses numerous scientific objectives, but the direct measurement of the physical conditions under which plate boundary earthquakes occur succinctly states its overall purpose.
While widely thought of as a single fault, it is probably better thought of as an extensive fault system that represents a major transform boundary between the North American and Pacific plates. Allen developed a subdivision of the fault system into four major sections based on the contrasting seismic activity observed over time.3
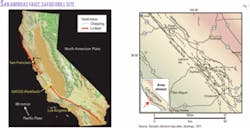
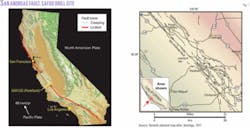
One of these subdivisions is the central California active or “creeping” section (blue portion of the fault trace in Fig. 1) that is located northwestward of the quiescent 1857 break. The earthquake of 1857 is the first historical record of an M~6 earthquake in the Parkfield area. Fig. 1 shows the spatial relationship between these subdivisions and the various segments of the San Andreas fault system.
The SAFOD site is in central California about 10 km northwest of Parkfield and immediately west of the San Andreas fault and Middle Mountain (Fig. 1). Two distinct basement terranes are exposed at this locality: the Salinian block to the southwest of the SAF and the Franciscan Complex to the northeast.
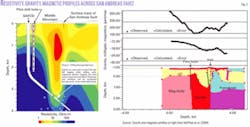
Unsworth and Bedrosian developed a resistivity profile across the SAF at the SAFOD locality that shows large contrasts in subsurface rock units near the site.4 The well plan for SAFOD is superimposed on the resistivity profile in Fig. 2.
Recent drilling and sampling results indicate that the resistivity profile portrays the approximate position of subsurface boundaries between different rock units comprising the basement terranes. Gravity and magnetic profiles at the site5 present a similar picture of the gross subsurface structure of the site (Fig. 2).
The presence of these terranes on opposite sides of the fault at the SAFOD site results from prolonged post-Miocene dextral slip of about 320 km along the SAF.6 7 At the SAFOD locality, the Salinian block consists of Cretaceous granitic rocks and local metamorphic rocks that are unconformably overlain by a veneer of nearly flat-lying upper Cenozoic marine and nonmarine strata as well as local volcanic rocks. Based on geologic data acquired during drilling of the SAFOD pilot hole during 2002, the Salinian block is a competent structural unit with only minor folds developed in strata that overlie the granitic rocks.
SAFOD study description
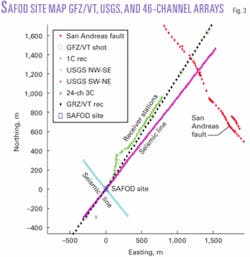
In conjunction with the US Geological Survey, Duke University has collected several unique datasets at the SAFOD site. During 2003, the US Geological Survey conducted a high-resolution surface seismic survey in conjunction with a crustal profiling survey conducted by GeoForschungs-Zentrum (GFZ) and Virginia Polytechnic Institute (VPI). Fig. 3 shows a map view of the seismic survey lines of 2003 relative to the position of the San Andreas Fault and the receiver line set up for the drillbit seismic project during 2004.
Our imaging project began by recording VSP records at the SAFOD site using the multicomponent vertical array in the pilot hole during the 2003 field season. The large source charges used during the GFZ/VPI crustal profiling survey provided good signal at most levels of the vertical array we used for recording the VSP data.
Fig. 4 shows the tomographic profile we developed for the SAFOD site using the GFZ/VPI surface sources. The tomographic inversion was computed with data consisting of p-wave travel times from 47 shots from the 2003 GFZ/VPI crustal profiling effort. The resulting image is divided by the pilot hole since no rays cross this point.
Subsequently, we used the tomographic profile as the starting point for our velocity estimates in processing the drillbit seismic data as well as developing a preliminary idea of potential changes in geology or subsurface conditions.
We also used the VSP recordings for the analysis of shear wave propagation and possible velocity anisotropy. The approach of our study was to process the downhole recordings of shots at small offsets from the pilot hole and examine s-wave propagation as well as s-wave anisotropy because of future applications to imaging of subsurface structure, a primary goal of the SAFOD effort.
Our methodology utilized the theory of filtering and time series modeling for VSP processing and imaging as discussed in Haldorsen.8 We selected surface shots within 1 km of the pilot hole for initial inspection and analysis because we wanted to analyze data with approximately vertical ray paths (i.e., <40-45°, if possible) to the receivers.
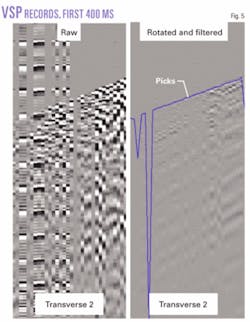
The first step of the digital processing flow was the application of sorting based on component type vs. depth of each component. The left panel in Fig. 5 shows a raw record of the transverse 2 component after sorting but before noise reduction.
We continued the processing flow with the application of noise reduction filters that we wished to test in hopes of eliminating noise characterized by high-amplitude coherent energy that appears as periodic noise spikes in the left panel. The right panel shows the same data after application of a noise-reduction filter that models the noise as “pickup” noise, i.e., different channels pick up the same electric signal but at different amplitudes.
The success in eliminating the noise present in various channels of the three-component gathers allowed us to continue our study to the next step of a numerical analysis of the transverse gathers for an assessment of shear-wave velocities and any accompanying differences in velocities of the transverse components of the wave field.
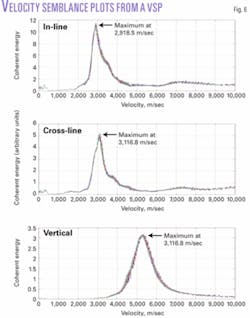
Results of the p-wave and s-wave velocity analyses for the vertical seismic profiles gave a preliminary indication that significant differences exist in the maximum velocity for the in-line and cross-line transverse components.
The maximum velocity for the in-line shear wave component is about 2,920 m/sec whereas the maximum velocity for the cross-line shear wave component is about 3,120 m/sec. Fig. 6 shows the coherent energy computed as a result of multichannel velocity semblance calculations for the VSP recorded from a source at 400 m offset from the pilot hole.
Subsequently, we plotted velocity semblance as a function of azimuth of rotation to show that the horizontal components exhibited a mutual and predictable velocity variation with rotation angle. Using the maximum coherence for velocity semblance vs. rotation angle, we determined that the in-line transverse component had a maximum velocity at about -7º rotation with respect to the azimuth of the acquisition line. The cross-line transverse component reached a maximum velocity at >82º. We interpret this s-wave velocity anisotropy to indicate s-wave splitting, which results from preferential orientation of the subsurface geologic structure at the SAFOD site.9
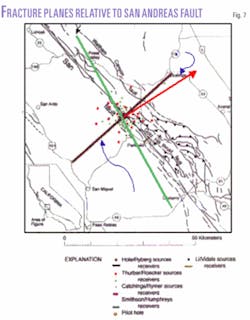
We also interpret the shear-wave anisotropy to indicate vertical fractures oriented at about 82º to the azimuth of the GFZ/VPI acquisition line. This orientation of these fractures corresponds to an angle of about 12º with the trend of the San Andreas fault (Fig. 7).
Based on previous studies concerning the formation of Riedel shears in strike-slip environments,10 11 we propose that the interpreted orientation of fractures causing the shear-wave velocity anisotropy is consistent with the formation of R shears at the SAFOD site.
Drillbit seismic data collection
In a typical VSP survey such as the recordings described above, the geometry is generally that of a near offset surface seismic source and a wireline tool with one or more geophones suspended in the borehole. The concept of using the drillbit as a downhole seismic source and recording the seismic energy from the bit at the surface with a geophone array inverts or reverses the conventional geometry of a VSP survey.
During the drilling operation, the drillbit produces low-level seismic energy as it crushes rock fragments and moves downward through the rock. Recording this energy is the basis for the drillbit seismic method.
The seismic profile produced with this method has therefore been referred to as a “reverse vertical seismic profile” (RVSP) or “inverse vertical seismic profile” (IVSP). In this article, we use “inverse vertical seismic profile” to indicate the use of a downhole seismic source instead of the standard VSP configuration.
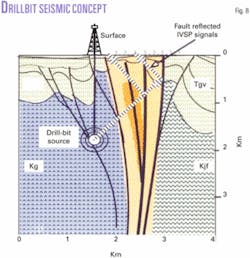
Fig. 8 shows a conceptual diagram of how seismic wave propagation from the drillbit might reflect off the main trace of the San Andreas fault zone and be recorded at the surface by an array of geophones placed across the fault.
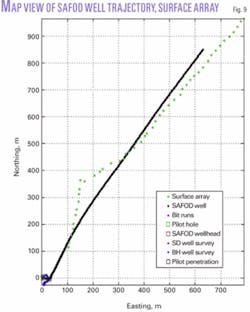
Although the vertical array had been installed previously in the pilot hole at the SAFOD site, there was no existing array of surface geophones to record the drilling of the SAFOD borehole. Schlumberger donated sufficient resources to obtain accelerometers that were recorded on two channels, a 48-channel seismograph and the geophones and cabling to install a 46-channel surface array of geophones extending from the drilling location. The 46-channel array was oriented northeastward from the rig toward the SAF along the azimuth proposed for the deviated borehole that is now instrumented as a subsurface observatory (Fig. 9).
The drillbit seismic method normally uses the recording of accelerometer data from the drillstring in addition to the surface geophone data. Since the seismograph had 48 available channels, the surface geophone array was configured with 46 channels and the 2 remaining channels available on the seismograph were used to record one vertical component accelerometer and one horizontal component accelerometer mounted on the gooseneck of the drill rig’s top-drive unit.
In addition to recording the drillbit data with the surface array, we simultaneously recorded the drillbit energy using three-component geophones located in the pilot hole (Fig. 9). The data collected during this study have provided us with valuable seismic information that supplements our previous data of spatially coarse vertical seismic profiles from the GFZ/VPI survey. We now have drillbit seismic data with a 10-m subsurface source interval to use for interpretation of the physical properties of rocks in the study area.
Processing drillbit seismic data requires the use of numerous digital signal-processing techniques. Schlumberger Technology Corp. furnished the DBSeis field processing software for data recording, reduction, and quality control of the drillbit seismic recording. The primary processing techniques used in this study are correlation, adaptive filtering, digital array filtering with beamforming techniques, and multi-channel deconvolution.12 Ancillary processing techniques include notch filtering for electrical noise and band-pass filtering of the output wave field.
Data examples
The primary products of the drillbit seismic-data-processing architecture are the one-way time wave field (IVSP data), the drillstring image, and the check shot.
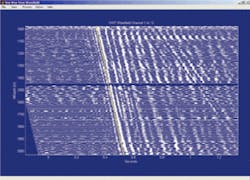
The one-way time wave field is the main product and is used for imaging the subsurface structure because it contains the first arrivals from the drillbit to the receiver array as well as the seismic wave field (Fig. 10). Picks of the first arrivals in the one-way time wave field are used to generate the check shot dataset that provides a highly accurate estimate of the formation velocity. The drillstring image is used for both quality control and velocity estimation of the drill steel.13
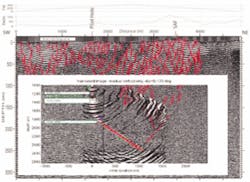
We migrated the one-way time wave field to produce an image of the subsurface near the SAFOD wellbore. Fig. 11 shows the results of the migration as an inset to a migrated surface-reflection profile (PSINE data) collected by the USGS.
The PSINE profile was generated from a surface seismic survey line parallel to the drillbit seismic profile. Catchings et al. processed the data through to a migrated profile and discussed velocity information determined by tomographic inversion of first-arrival data from shots of the survey.14
We interpreted the profile, which shows both the shallow Tertiary sedimentary cover and the Salinian block to be cut by a series of steeply dipping faults (red lines in Fig. 11). Although the PSINE profile is offset about 200 m from the geophones for the drillbit seismic line, there is a strong correlation between the subsurface trend of fracture zones. Based on drilling and sampling data, the well intersected several fracture zones during drilling. In addition, well logs show that numerous fractures and several shear zones were penetrated. Fig. 11 also shows the major shear zones labeled with the drillbit seismic data as an inset to the PSINE profile.✦
References
1. Rymer, M.J. Catchings, R.D., and Goldman, M.R., “Structure of the San Andreas fault zone as revealed by surface geologic mapping and high-resolution seismic profiling near Parkfield, California,” Geophysical Research Abstracts, Vol. 5, 2003, 13523.
2. Diblee, T.W., Jr., “Geology along the San Andreas fault from Gilroy to Parkfield,” in Streitz, R., and R. Sherburne, eds., Studies of the San Andreas fault zone in northern California: California Division of Mines and Geology Special Paper 140, 1980, pp. 3-18.
3. Allen, C.R., “The tectonic environments of seismically active area along the San Andreas fault system,” in Dickinson, W.R., and Grantz, Arthur, eds. Proceedings of Conference on geologic problems of the San Andreas fault system, Stanford University Publications in the Geological Sciences, Vol. 11, 1968, pp. 70-82.
4. Unsworth, M., and Bedrosian, P.A., “Electrical resistivity structure at the SAFOD site from magnetotelluric exploration,” Geophysical Research Letters, 31, 2004, L12S05.
5. McPhee, D.K., Jachens, R.C., and Wentworth, C.M., “Crustal structure across the San Andreas Fault at the SAFOD site from potential field and geologic studies,” Geophysical Research Letters, 31, 2004, L12S03.
6. Hill, M.L. and T.W. Diblee Jr., “San Andreas, Garlock, and Big Pine faults, California: A study of the character, history, and tectonic significance of their displacements,” Geological Society of America Bulletin, Vol. 64, 1953, pp. 443-458.
7. Crowell, J.C., “An outline of the tectonic history of southeastern California,” in Ernst, W.G., ed., The geo-tectonic development of California (Ruby Vol. 1), 1981, Englewood Cliffs, NJ: Prentice-Hall.
8. Haldorsen, J.B.U., Miller, D.E., and Walsh, J.J., “Multichannel Wiener deconvolution of vertical seismic profiles,” Geophysics, Vol. 59, 1994, pp. 1500-1511.
9. Taylor, S.T., Malin, P.E., Haldorsen, J.B.U., “Shear wave anisotropy observed in VSP data at the San Andreas Fault Observatory at Depth,” Society of Exploration Geophysicists 2005 Annual Meeting, Expanded Technical Program Abstracts; 2005.
10. Tchalenko, J.S., “Similarities between shear zones of different magnitude,” Geological Society of America Bulletin, Vol. 81, 1970, pp. 1625-1640.
11. Lou, M., Shalev, E., and Malin, P.E., Shear-wave splitting and fracture alignments at the northwest Geysers, California, Geophysical Research Letters, Vol. 24, No. 15, 1997, pp. 1895-1898.
12. Haldorsen, J.B.U., Miller, D.E., and Walsh, J.J., “Walk-away VSP using drill noise as a source,” Geophysics, Vol. 60, 1995, pp. 978-997.
13. Taylor, S.T., Malin, P.E., Shalev, E., Haldorsen, J.B.U., Coates, R., and Stolte, C., “Drill bit seismic imaging of the San Andreas Fault System at SAFOD,” Society of Exploration Geophysicists 2005 Annual Meeting, Expanded Technical Program Abstracts; 2005.
14. Catchings, R.D., Rymer, M.J., Goldman, M.R., Hole, J.A., Huggins, R., and Lippus, C., “High-resolution seismic velocities and shallow structure of the San Andreas Fault zone at Middle Mountain, Parkfield, Calif.,” Bulletin of the Seismological Society of America, Vol. 92, 2002, pp. 2493-2503.
The raw one-way time wave field recorded by the 46-channel vertical component surface array is shown here. A strong shear wave arrival occurs approximately midway in the wave field and has a slope about twice that of the p-wave first breaks (Fig. 10).
USGS PSINE profile with inset shows the migrated drillbit seismic image. Faults interpreted on the PSINE profile are in red. The SAFOD well path is also in red within the inset. Rectangles in the inset indicate locations of major shear zones (Fig. 11).
The authors
Stewart Taylor (stewart.taylor @duke.edu) is pursuing a PhD at Duke University, Durham, NC. His interests include subsurface imaging with seismic and electro-seismic prospecting for exploration of the earth’s interior. He holds a BS in geology from Eastern Washington University and an MS in geophysics from West Virginia University (1990). He is a member of the SEG and holds professional registrations as a geologist with specialty licenses in geophysics and hydrogeology.
Christian Stolte (cstolte @houston.westerngeco.slb.com) is a senior geophysicist at WesternGeco, Houston. He joined Schlumberger in 1996 developing software for surface and borehole seismic processing in Gatwick, UK, and Tokyo, Japan. As product champion for DBSeis, the Schlumberger drillbit seismic system, he worked in Ciudad del Carmen, México, supervising field operations worldwide. In April 2005, he joined the survey evaluation and design group of WesternGeco. He received an MSc (1986) in earth sciences from the University of California at Santa Clara and a PhD (1995) in geophysics from Christian-Albrechts University, Kiel, Germany. He is a member of the Society of Exploration Geophysicists.
Jakob B.U. Haldorsen ([email protected]) is scientific advisor at Schlumberger-Doll Research. Before joining the geophysical community with GECO in 1981, Haldorsen did experimental particle physics at the University of Oslo and was a CERN Fellow at the European Organization for Nuclear Research (CERN) in Geneva. When Schlumberger purchased GECO in 1987, he joined Schlumberger-Doll Research. He received a cand. mag. degree (1967) and cand. real. degree (1971) in physics from the University of Oslo. He is a member of the Society of Exploration Geophysicists.
Richard Coates ([email protected]) is a research scientist and program manager at Schlumberger-Doll Research. Between 1990 and 1992 he was a founding member research fellow at the Earth Resources Laboratory, Massachusetts Institute of Technology. In 1992, Coates joined Schlumberger Cambridge Research as a research scientist in the seismics department. Beginning in 1997, he has worked at Schlumberger-Doll Research. Coates holds a BA and MA in physics and a PhD in geophysics from the University of Cambridge UK. He is a member of the Society of Exploration Geophysicists.
Peter Malin ([email protected]) is a professor of seismology at Duke University, Durham, NC, where he holds appointments in the earth and ocean sciences division and the department of civil and environmental engineering. He received a BS and MS in geophysics from Stanford University and completed a PhD in theoretical seismology at Princeton University. Malin is a member of the Society of Exploration Geophysicists.
Eylon Shalev ([email protected]) is a research scientist at Duke University, Durham, NC. He received a BS (1981) in geology from Ben Gurion University and a PhD (1993) in geophysics from Yale University. He is a member of the American Geophysical Union, the Seismological Society of America, and is the university representative to Incorporated Research Institutes for Seismology (IRIS).
