Oil to lead US energy demand growth in 2005
Total energy consumption in the US will grow again this year, buoyed by increased economic activity and the need for greater quantities of transportation fuels.
Energy demand across all major sources will grow, with oil leading. The growth rates for jet fuel and motor gasoline will increase from a year ago, while those for other products will decline.
While Alaskan oil output continues to slide, total US crude and condensate production will rebound in 2005. Imports of oil and products will decline slightly while inventories shrink a bit. Refining activity will remain strong, with capacity utilization averaging 92% for the year.
Natural gas production in the US will climb following a 2004 decrease. LNG imports will move up, but not as much as last year, and gas imports from Canada will continue to shrink.
Economy and energy
OGJ forecasts US economic growth this year, as measured by the gross domestic product (GDP), at 3.5%.
The economy grew faster than expected last year. During the first quarter, real GDP—the output of goods and services produced by labor and property located in the US—increased by an estimated 4.5%
Real GDP increased 3.3% in the second quarter and at an annual rate of 4% in the third quarter, according to the latest estimates by the US Bureau of Economic Analysis (BEA).
Major contributors to the third-quarter increase in real GDP were personal consumption expenditures, equipment and software, exports, government spending, and residential fixed investment. These components offset a negative contribution from private inventory investment. And imports, which are a subtraction in the calculation of GDP, increased during the third quarter, BEA reported.
Third-quarter corporate earnings from production declined due to Hurricanes Charley, Frances, Ivan, and Jeanne. Benefits paid by US insurance companies reduced earnings by $69.3 billion. In addition, corporate profits were reduced by $10.4 billion for uninsured losses, according to BEA.
Interest rates remained low last year, as the Federal Open Market Committee left the federal funds rate—applied to overnight loans between banks—at 1% until initiating a series of 25-basis-point increases on June 30, 2004. At the end of last year, the federal funds rate stood at 2.25%.
Construction spending grew last year, as did personal income and personal consumption, while the unemployment rate declined slightly.
Total energy consumption
Energy consumption in the US will increase almost 2% this year, and the efficiency gains of 2004 will not be repeated.
US energy consumption last year totaled 99.58 quadrillion btu (quads). The economy grew faster than expected, and the amount of energy that fueled the growth surpassed OGJ's year-ago forecast as well.
Energy efficiency last year improved an estimated 3%, but this year the ratio of energy consumed per dollar of GDP will fall less dramatically. The 2005 efficiency gain is forecast at 1.7%.
Energy sources
OGJ forecasts that total US energy demand will be 101.28 quads this year. Last year the US posted demand growth for each major source of energy except natural gas, demand for which dipped an estimated 0.2%.
Demand for oil products will grow the most this year, up 2%. This increase will be led by motor gasoline and jet fuel, demand for both of which will grow more than last year. Demand growth for distillate, residual fuel oil, liquid petroleum gas, and ethane will slow. Oil this year will account for 40.3% of all energy consumed in the US.
Closer-to-normal winter weather will help boost gas demand. OGJ expects 2005 US gas demand to total 22.88 quads, up 1.5% from last year. This will mean that gas satisfies 22.6% of US energy demand this year, the same percentage as last year.
Coal demand, representing 23% of the US energy market, will grow faster than last year. Mild weather tempered demand for coal in 2004, resulting in demand growth of only 1%. A return to normal weather will push demand for coal to 23.3 quads this year, a 1.6% increase.
US demand for nuclear energy, which reached an all-time high last year, will climb again in 2005. OGJ projects that nuclear energy generation will grow 1.7% this year, following last year's 2.3% surge. US nuclear plants this year will supply 8.2% of the country's energy.
OGJ forecasts that the use of hydroelectric energy and other renewable energy will increase 1% this year, more than the 2004 increase but not enough to prevent a minute decline in this category's share of the total energy market.
The use of renewable energy sources is constrained by weather. During 2004, drier weather held growth in the use of hydroelectric energy to a mere 0.6%. The use of other renewable energy sources, including solar and wind, increased last year, but OGJ expects demand for these sources to be little changed in 2005.
Oil supply
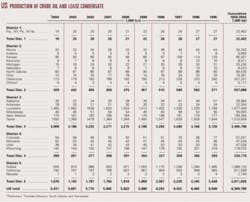
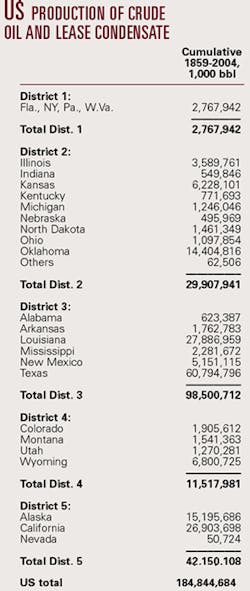
This year's expected rebound in production of crude and condensate from suppressed levels of 2004 will follow declines each year since 1991. Last year's decrease was unusually large because of production shutdowns in the Gulf of Mexico necessitated by hurricanes. Also boosting US output this year will be new deepwater production in the gulf.
US crude and condensate production this year will move up almost 3% to 5.6 million b/d. Production declined last year more than 4%.
High oil and gas prices have spurred investment in exploration and production, as rig counts prove. The Baker Hughes Inc. count of active rigs for the US grew to an average 1,192 last year, up from 1,032 a year earlier.
However, the Baker Hughes rig count for Alaska last year averaged 10, the same as a year earlier, and the count of rigs in the US offshore declined to an average of 96 from 108 in 2003.
Growth in the total US rig count reflects substantial gains in Colorado, onshore Louisiana, Montana, Oklahoma, onshore Texas, Utah, and Wyoming. The counts for offshore Louisiana and offshore Texas declined last year.
The only state to record an appreciable increase in crude and condensate production last year was Montana, according to OGJ's preliminary estimates. Montana's 2004 output of crude and condensates increased to an estimated 62,000 b/d from 53,000 b/d a year earlier.
Average Alaskan oil production last year declined to 935,000 b/d from 974,000 b/d the prior year. Other than a small increase in crude and condensate production in 2002, average Alaskan output has declined each year since its peak of 2 million b/d in 1988.
This year, US production of NGL and other liquids will grow but at a slower pace than last year. In 2004, such output increased 5% to 2.25 million b/d, but OGJ expects growth of 2.2% this year. This will put 2005 total US liquids production at 7.9 million b/d, up 2.6% on the year.
Inventories
Total commercial stocks of crude oil and products will decline in 2005 after a year of increase, and oil in the Strategic Petroleum Reserve (SPR) will reach capacity.
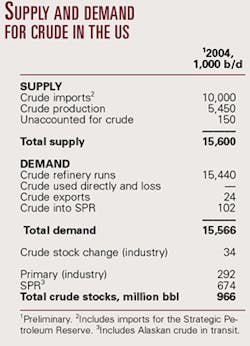
The amount of crude oil in storage, excluding that in the SPR, ended last year at 292 million bbl, up from 269 million bbl a year earlier. The end-2004 level is in the upper half of the previous 5-year range.
Stocks of motor gasoline and residual fuel oil ended 2004 above their 5-year average ranges, while distillate stocks were near the bottom.
OGJ forecasts that total US product stocks will end this year at 665 million bbl, down from 677 million bbl a year earlier. Meanwhile, crude inventories will end 2005 at 289 million bbl.
Crude in the SPR rose last year to 674 million bbl from 638 million bbl at yearend 2003 as the inventory continued to build toward its 700 million bbl capacity. OGJ expects the SPR to hit that mark this year.
Imports
Total imports of crude and products will decline marginally this year. Last year, imports grew more than 4%, with the majority of the increase being product imports, especially of motor gasoline. No oil has been imported for the SPR since 2002, when the average was 16,000 b/d.
The source of the most crude oil imports last year was Canada, from which the US imported an average 1.622 million b/d through October, the most recent month of statistics from the US Energy Information Administration.
The second largest source of US crude imports last year was Mexico, followed by Saudi Arabia, Venezuela, and Nigeria.
Canada also led in exports of petroleum products to the US, with an average of 496,000 b/d. Following Canada were the US Virgin Islands, Algeria, Venezuela, and Russia.
Refining, prices
Refining capacity utilization will moderate slightly from high levels of the past 2 years.
OGJ expects utilization to average just over 92% this year as total inputs to US refineries grow less than operable capacity.
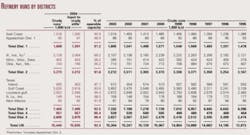
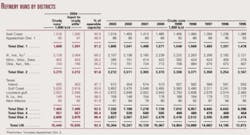
Total operable capacity will grow less than 1% this year, following a 1.1% increase during 2004, according to the American Petroleum Institute. Crude runs will increase 0.7%, less than last year.
Refiners with the capability to run heavy crude enjoyed a large discount to sweet crudes last year. By the end of the year, the heavy-crude discount had narrowed some but remained high. Winter maintenance brought down margins at yearend.
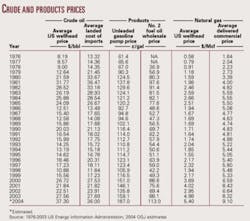
The spot price of Saudi Arabian Heavy crude oil averaged $30.50/bbl last year, up from $24.46/bbl in 2003, but still well below light crudes. The spot price last year for Nigerian Bonny Light averaged $37.85/bbl vs. $28.75/bbl a year earlier, and Brent climbed to $38.05/bbl from $28.78/bbl.
The composite refiner acquisition cost of crude oil averaged $37.75/bbl last year, according to OGJ estimates. For 2003, the refiner acquisition cost of crude averaged $28.60/bbl.
Gasoline pump prices were also stronger last year. OGJ estimates that the price in the US averaged $1.87/gal vs. $1.59/gal in 2003.
Through the first 11 months of last year, the US Gulf Coast cash refining margin averaged $6.57/bbl, according to Muse, Stancil & Co. This compares to a full-year 2003 average of $3.23/bbl. Also through November, the 2004 US West Coast refining margin averaged $12.60/bbl vs. $5.80/bbl for all of 2003.
Oil demand
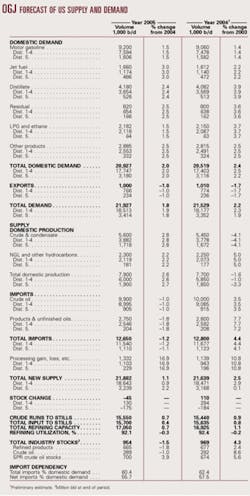
Demand for oil products in the US will grow 2% in 2005 following a 2.4% jump last year, bolstered by consumption of transportation fuels. Demand for jet fuel will lead the products in increases, but demand for all petroleum products will grow as the economy continues its expansion.
OGJ predicts that US demand for all oil products will increase to 20.93 million b/d. US exports will decline to 1 million b/d from 1.01 million b/d last year and 1.03 million b/d in 2003.
Motor gasoline
Motor gasoline demand will average 9.2 million b/d this year, up 1.5%.
In spite of high pump prices, gasoline demand grew 1.4% last year, mostly in the first half. High summer gasoline prices curtailed demand growth, and by August, demand growth was nil. That month, motor gasoline demand reached its 2004 peak, averaging 9.244 million b/d.
US pump prices were their highest in June, at an average of $2.04/gal for regular unleaded, according to EIA figures. The regular unleaded pump price then declined to $1.94/gal in July, $1.90/gal in August, and $1.89/gal in September.
Jet fuel
Demand for jet fuel will grow 3% this year, as commercial air travel continues to increase.
Year-on-year jet fuel demand growth in 2004 rebounded from weak consumption in the first half of 2003, which was hampered by the war in Iraq and the SARS epidemic in Asia.
OGJ estimates that last year, jet fuel demand averaged 1.61 million b/d, up 2.2% from a year earlier. The latest data available from EIA indicate that 2004 jet fuel demand peaked in August at 1.7 million b/d.
Distillate
Consumption of distillate grew last year on the strength of demand for transportation fuels and heating oil. This strength will continue this year, boosting distillate demand 2.4%.
Last year, demand for distillate increased nearly 4% and drove down inventories of heating oil. The last 2 months of 2004 were colder than the same 2003 period, which lifted demand for heating oil in the northeastern US. Still, the weather in late fall and early winter of 2004 was not as cool as weather forecasts predicted.
Despite a spike in diesel prices, highway freight transport used more distillate last year than during 2003 and will record another gain this year.
Residual fuel oil
The rate of growth in residual fuel oil demand will decline this year to 2.5% from 3.6% last year.
While the ability to switch to resid from natural gas is limited to a shrinking number of industrial and electric utility plants, fuel substitution produced last year's demand spurt because the price of gas was high. As oil-fired electric power generation wanes, so will resid demand over the long term.
Another major use for resid is as marine fuel, so the strengthening economy and an increased need for commercial shipping will be a positive influence this year.
Other products
Demand this year for all other petroleum products also will grow. This category of products includes pentanes-plus, unfinished oils, gasoline blending components, and others.
Increased construction spending will increase the need for lube oils and asphalts. And increased petrochemical production will boost the consumption of feedstocks.
OGJ forecasts a 2.5% increase in the use of all the products in this category, keeping pace with last year's gain amid continued economic growth.
The big mover in the category last year was demand for propane and propylene, which through the first 10 months of 2004 grew nearly 6% from a year earlier. For the same period, demand for liquid petroleum gas gained 4%.
Natural gas
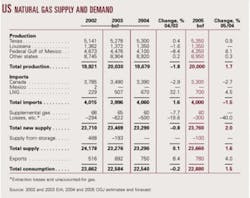
As prices ease and the economy requires more energy this year, US demand for gas will rebound following a 0.2% reduction last year. Gas production in the US will increase while a decline in imports from Canada offsets a gain in LNG imports.
While gas consumption in the residential and commercial sectors declined last year, the industrial sector used more gas than during 2003. And although gas demand this year in the residential sector may recover, OGJ expects commercial sector gas use to continue to show weakness.
The electric power sector, which includes electric utilities and independent power producers, consumed 4.93 tcf of gas in 2003, down from a record 5.67 tcf a year earlier. In 2004, this sector's gas consumption rebounded slightly.
The amount of working gas in underground storage in the US ended 2004 near the top of the 5-year range and above the year-earlier level, as weather-related gas demand was lower than normal.
Despite ample supply, the price of gas was propped up last year by strong oil prices.
The high prices spurred less drilling activity than might be expected, though. While gas-directed drilling grew in the Rocky Mountain region and northern Texas last year, the gas-directed rig count in other regions was lackluster.
The Baker Hughes count of rigs drilling for gas in the US hit an all-time high for the week ended Sept. 3, 2004, at 1,082. Following that record-setting week, the hurricane season slowed activity. For the last week of 2004, the number of gas-directed rigs operating in the US was 1,070. The end-2003 gas-directed rig count was 966.
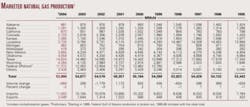
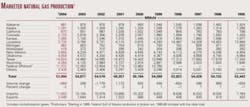
US gas production in 2005 will rebound about the same amount that it fell last year. OGJ forecasts that production will be 20 tcf, up 1.7%.
Production of gas declined last year by 1.6% in Louisiana and 8.4% in the federal Gulf of Mexico but increased 0.4% in Texas. All other states collectively posted a 0.2% increase in gas production.
OGJ expects that gas production will continue to grow in Texas this year, climbing almost 1%, while Louisiana gas production holds steady at 1.35 tcf. Also, barring another especially busy 2004 hurricane season in the Gulf of Mexico, production from federal gulf areas will increase a little more than 6%.
The US will import less gas this year. Imports from Canada will decline 2.7% following a 2.9% drop last year. And Mexican demand for gas again will mean that the US imports no gas from Mexico.
LNG imports will grow 4.5% this year to 700 bcf. US imports of LNG last year surged 32%, with big increases from Algeria, Australia, Malaysia, and Trinidad and Tobago.
In 2005, the US will export 780 bcf of gas, up from 750 bcf last year. Exports via pipeline to both Canada and Mexico grew during 2004, while US LNG exports to Japan were little changed.
Correction
Two tables in the Forecast & Review report contained errors (OGJ, Jan. 17, 2005, pp. 22, 23). Correct values for the affected columns appear here.


