In August, US gasoline customers witnessed a sharp escalation in pump prices, which only recently began to abate. In the search for culprits, attention initially focused on crude prices, the key cost component in the production of gasoline. However, crude prices in July and August were relatively stable and declined through the first 3 weeks of September. Moreover, prices of other products, including diesel, jet fuel, and fuel oil did not show the same sharp price increases as gasoline.
There were some summer gasoline supply hiccups, including those related to the blackout of electric power in the northeastern US and the rupture of the gasoline pipeline supplying Phoenix. Under normal circumstances, they would not have led to such a sharp, nationwide run-up in prices. However, circumstances were not normal.
In particular, gasoline inventories, especially for reformulated gasoline, were very low into early summer and dropped even lower in response to an unexpectedly large surge in demand for gasoline in August. The combination of low inventories and sudden higher demand meant the supply problems that did occur had a magnified impact on prices.1
Price developments
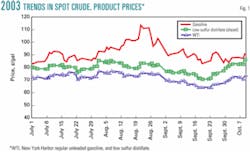
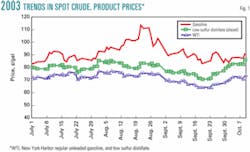
Fig. 1 summarizes daily trends since early July in spot prices for gasoline, low sulfur distillate (diesel fuel), and crude oil, using New York Harbor product prices and the West Texas Intermediate crude price. All prices are in cents per gallon.
At the beginning of July, spot WTI prices averaged about 72¢/gal (about $30.25/bbl) or about 7.5¢ below the 80¢/gal New York Harbor price for diesel fuel and 11¢ below the 83¢/gal price for regular unleaded gasoline.
Beginning in early August, however, spot gasoline prices moved up sharply, reaching peak levels of just over $1.10/gal during Aug. 21-23, a rise of about 38¢ from their levels in early July. At the same time, diesel prices were averaging about 83¢/gal, only 3¢ above their early July level while crude prices averaged about 76¢/gal (just under $32/bbl), up only about 4¢ ($1.70/ bbl) from their early July level.
Although not shown, spot prices for other products such as jet fuel and fuel oil showed subdued movements similar to those for diesel fuel.
At their August peak, spot regular unleaded gasoline prices averaged about 35¢/gal above the crude price, far above the 11¢ differential prevailing at the beginning of July. Spot gasoline prices fell back in late August with further declines coming through mid-September. Since then, spot gasoline prices have been relatively stable. Crude prices also declined through mid-September but at a much slower pace. Since then, they have moved up by about 6¢/gal ($2.50/bbl), an upward movement not shared by gasoline.
By end-September into early October, the differential between spot gasoline and WTI had narrowed to about 15¢/gal, far below the August peak, and only about 5¢ above the differentials prevailing in early July. Spot prices for low-sulfur distillate have continued to move roughly in line with crude prices, although with a slight increase in the differential into October as would be expected with the approach of the heating season and the seasonal increase in demand for heating oil.
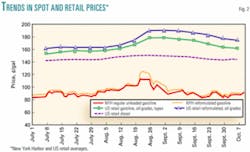
Fig. 2 focuses on the relationship between spot and retail gasoline prices. As before, the figure shows the spot price for New York Harbor 87 octane, regular unleaded gasoline and adds one more, the spot price for New York Harbor 87 octane RFG. For retail prices, the chart shows US average retail prices for all grades and formulations, and for all grades of RFG. As a notation item, the chart also shows the national average retail prices for diesel fuel.
For the most part, the New York Harbor prices for regular and RFG show little difference, with reformulated prices averaging about 3.5¢/gal higher than regular gasoline prices. But during August, spot reformulated prices rose at a faster pace. At its peak, the spot RFG price reached nearly $1.15/ gal, more than 10¢ above the spot price of regular unleaded. Thereafter the gap between the two narrowed substantially, falling to about 2¢/gal by mid-September.
As was the case for spot prices, retail gasoline prices moved up significantly, beginning in early August, with retail prices for RFG outpacing the overall national average. National average retail prices moved up at a slower pace than the New York Harbor spot prices.
Since late August, retail average prices have been declining, although, as on the way up, at a slower pace than spot prices. As of early October, the average US retail gasoline price was about 9¢/gal above its level at the beginning of July while the New York Harbor price for regular unleaded was about 4¢ above its early July level. Note that the retail price for diesel showed very little movement over the time period, a pattern consistent with the previously shown far more stable pattern of spot prices for low sulfur distillate—and for crude.
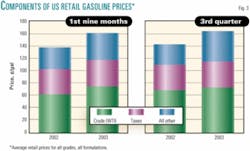
Fig. 3 looks at the components of US retail gasoline prices, dividing them between crude cost, represented by WTI, federal and state taxes, and "All other," which includes refiner, wholesale, and dealer margins as well as distribution costs and changes in sales mix. The figure shows components for the first 9 months of this year and 2002 on the left, and for the third quarter of this year and last on the right.
As shown in Fig. 3, for the first 9 months of this year the average US retail gasoline price was about $1.61/gal, up about 26¢ vs. 2002. About 14¢ of the difference is accounted for by crude with nearly all the remainder accounted for by the "All other" category. Average taxes were up marginally, by less than 1¢/gal. Averages for the first 9 months include the run-up in crude prices, first as a result of the disruption in Venezuelan supplies, and then market concerns about the potential impact of the approaching war with Iraq.
These upward influences on crude prices had dissipated by the third quarter—when gasoline prices hit their peak. As shown on the right, in the third quarter of this year, gasoline prices averaged about $1.65/gal, about 21¢ above the third quarter of 2002. The crude cost component was only marginally higher, 72¢/gal vs. 67¢. The "All other" component, on the other hand, was significantly higher: 50¢ vs. 34¢, a rise of 16¢/gal.
Oil imports, inventories
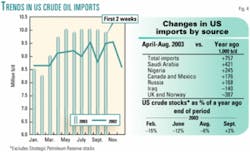
The relatively stable price pattern for crude reflects a major improvement in supply availability over the past several months. Fig. 4 shows, on the left, US crude oil imports for this year through early October, and for comparative purposes, imports in 2002.
After lagging in the early months of the year, beginning in April imports moved up sharply to levels well above the year before. From April through September, imports this year have averaged over 800,000 b/d above year-ago levels. Early October data suggest the gains are continuing, although perhaps at a lesser pace.
The table on the right in Fig. 4 shows changes in imports by selected sources for April-August of this year vs. a year ago. August is the latest month for which such data are available. For the 5-month period, total crude imports were up an average of 757,000 b/d. By far the largest single source of increased imports was Saudi Arabia, accounting for more than 400,000 b/d of additional imports or about 56% of the total.
Other sizable increases came from Nigeria, Canada, and Mexico, and, making its debut as a significant supplier to the US, Russia. Not all sources shared in the increase. Imports from Iraq of course were lower, as were imports from the two major North Sea producers, Norway and the UK.
The improvement in supply availability has led to a gradual recovery in crude inventories. As shown in the bottom of Fig. 4, inventories—excluding the Strategic Petroleum Reserve (SPR)—at the end of February were 15% below year-earlier levels. By the end of June, the gap had fallen to 12% and by the end of August, 6%. As of the end of September, inventories had moved to 2% above year-earlier levels. Although not shown, the gains continued into the first weeks of October.
Thus the late-summer surge in gasoline prices came as conditions in the crude market were easing, a further indication that the causes for what happened to gasoline lie elsewhere.
Gasoline inventory
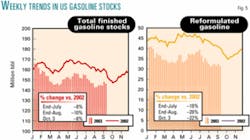
The gasoline price surge this past summer reflects almost entirely the particular supply-demand conditions for the product itself. Fig. 5 summarizes a key aspect of these supply-demand conditions: inventories.
The panel on the left in Fig. 5 shows weekly inventory levels for finished gasoline since the beginning of the year and, for comparison, weekly inventories in 2002.
In early January, inventories stood slightly above year-earlier levels but fell back sharply through the end of March. They subsequently rose into June but nonetheless remained significantly below year-earlier levels. At the end of July, on the eve of the gasoline price run-up, they were 8% below year-earlier levels (and about 8% below the end of July average for the past 5 years). Several factors contributed to this development.
The strike-related loss of Venezuelan crude supplies late last year restricted imported crude availability to US refiners and, with a lag, refined product output. In addition, Venezuela is the prime supplier of crude to the US Virgin Islands refinery, which in turn is a supplier of gasoline to the US mainland. In 2002, direct imports of finished gasoline and blending components from Venezuela and the US Virgin Islands exceeded 150,000 b/d. These supplies were also restricted in the early months of 2003.2
As Venezuelan supplies gradually improved, the onset of hostilities in Iraq virtually shut down crude exports from that country. Over time, higher production elsewhere, especially in Saudi Arabia, allowed a rebuilding of crude stocks.3
A further negative influence on gasoline stocks in the early months of this year was the cold winter which, combined with high natural gas prices, pushed up distillate requirements and in turn, constrained the seasonal shift of refiners to gasoline production.
From late July through late August, as gas prices were escalating, inventories fell further from their already low level. At the end of August, finished gasoline inventories were 10% below year-earlier levels.4 Since then, inventory levels have stabilized, indeed increased slightly, but still trail well behind year-ago levels. As shown in the right panel, the inventory situation was even more difficult for RFG. End of July inventories for reformulated were nearly 20% below year-earlier levels and at the end of August, nearly 30% below. Here too there has since been stabilization and modest improvement but the gap vs. last year remains very wide.
Stock levels and year-on-year comparisons for finished gasoline and especially RFG are being impacted by the growing use of ethanol-based RFG in anticipation of state bans on methyl tertiary butyl ether (MTBE) use, especially in the largest market for RFG, California.
Because ethanol-based gasoline is more difficult to transport than MTBE-based gasoline, the blending of ethanol and RBOB (Reformulated Blendstock for Oxygenated Blending) takes place mainly at terminals close to final consumers.5
The shift to ethanol-based RFG is raising holdings of RBOB, a blending component as opposed to the finished product. While specific holdings of RBOB are not available, in late August through early September, when differences vs. year-ago for finished gasoline and reformulated were most pronounced, stocks of gasoline blending components (including RBOB) were up by about 3 million bbl, with the difference concentrated in Petroleum Administration for Defense District 5(PADD 5). Nonetheless, the 3 million bbl increase for blending components is far less than the 16-19 million bbl decline for finished gasoline and the 10-12 million bbl decline for reformulated.
Apparent consumption
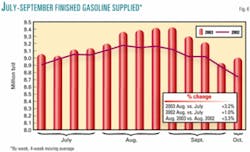
Part of the explanation for the falloff in already low inventories was a surprising late summer surge in apparent demand for gasoline. As a proxy for apparent consumption, Fig. 6 shows the US Energy Information Administration's weekly estimates of product supplied for gasoline since the beginning of July where product supplied represents the movement of gasoline out of refineries, blending plants, pipelines, and bulk terminals to consumers and secondary storage facilities. Because of the volatile nature of the data, Fig. 6 shows 4 week moving averages for this year and for the comparable weeks of 2002.
Between July and August of this year, apparent consumption as measured by finished gasoline supplied rose by 3.2% or nearly 300,000 b/d. The increase was far larger than the 1% increase that occurred between July and August 2002. August 2003 apparent consumption was 3.3% above the August 2002 level—vs. a 1.1% difference between the 2 years for July.
Despite sharply higher prices, the gains in demand continued through September. Indeed, apparent demand for the 4 weeks ended Oct. 3 was still about 3% above the year before. It's not fully clear why it occurred. The tax rebates contributed through their boost to disposable personal incomes, as did the sharp pickup in economic activity. A key element may also have been pent-up demand for vacation travel after an unseasonably cool, rainy start to the summer vacation season—combined with a continued reluctance to fly. The price increases moderated what would have been an even stronger growth in demand.
Production, imports
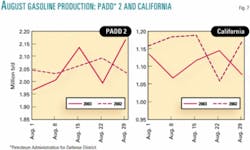
In principle, the sudden increase in demand could have been met at least in part through higher domestic production or higher imports. However, gasoline production, which meets over 90% of US demand, was hampered in the critical month of August by the impact of the blackout on refineries in the Midwest and refinery outages in California, where gasoline supply-demand balances tend typically to be tighter than elsewhere in the country. Fig. 7 shows the August weekly trends in gasoline production in PADD 2 and California.
In PADD 2, an upward trend in production was interrupted in mid-August as the blackout caused shutdowns at refineries in Michigan and Ohio that were only gradually brought back on line. Average production for the week ended Aug. 22, was nearly 150 million b/d below the average for the week ended Aug. 15. The blackout itself began in the late afternoon of Aug. 14. By the last week of the month, production had risen to slightly above its preblackout level. For the month as a whole, production was about even with year-earlier levels but this is in the context of rising demand and already low inventories.
In California, refining problems in the early weeks of August held gasoline production to well below year-earlier levels. In the week ended Aug. 8, gasoline production was nearly 120,000 b/d or 11% below the year-earlier level. For the period as a whole, production averaged 4% below a year ago. California's supply-demand balance was also impacted by refinery problems in Washington state and by the rupture of the pipeline from Tucson supplying gasoline to Phoenix that occurred at the end of July (OGJ Online, Aug. 22, 2003).
The rupture interrupted normal supplies from the US East and in the scramble for alternatives led to additional calls on gasoline from California.
For the US as a whole, gasoline production was up over this period by about 0.5%, thanks in particular to a 3.5% production gain in PADD 3, the country's main refining center. However, this 0.5% gain was far less than the apparent 3.3% gain in August apparent demand.
Regarding imports, it takes time for additional imports to reach the US after decisions are made to shop the market for new supplies. For most of the weeks shown in the figures here, gasoline imports moved more or less in line with year-earlier levels, indeed somewhat below them. However, in the week ended Aug. 29, imports rose sharply to 1.166 million b/d, up about 350,000 b/d from the week before and about 400,000 b/d from the same week in 2002. The increase came too late to head off the escalation in prices that occurred earlier but contributed to the subsequent easing of prices from their peaks.
Supply protection
The US entered the summer with low gasoline inventories and therefore very limited protection against supply interruptions and demand surprises. Both occurred.
While the low inventories were drawn down even further, much of the adjustment balancing demand with existing supply had to come through price. Because gasoline is a near-necessity with virtually no available substitutes, price elasticity—the measure of consumer responsiveness to price changes—is very low, especially in the near term. In such circumstances, the price increases triggered by even a small supply shortfall are disproportionately high. The problems with gasoline occurred despite clear improvement in crude supply and ongoing recovery in crude inventory levels. Hence the difference in price developments between gasoline and other refined products.
There are signs of modest improvement in gasoline inventories, and in any case the driving season is over. There are some important considerations for future driving seasons. First is the recognition that developments well before the driving season are critical influences on the gasoline market. These include any persisting, severe crude supply shortfalls, especially if combined with a cold winter and natural gas supply problems.
The government has an obvious policy instrument for dealing with crude supply shortfalls, namely the Strategic Petroleum Reserve. There are no specific policies targeting gasoline supply although there are policies that nonetheless have an impact—in certain cases perversely. In particular, the well-known problems of "boutique" fuels and market fragmentation are threatening to become even more acute.
Beginning in 2004, New York and Connecticut intend to join California in banning MTBE from gasoline. Since their neighbors, notably New Jersey—the nearest refining and product storage center—are not following suit, this means that as of next year reformulated or oxygenated gasoline for sale in New Jersey would not meet the specifications for sale in New York and Connecticut. The result would be to reduce the protective value of the region's inventories in meeting any potential New York-Connecticut supply-demand imbalances. A top government policy priority ought to be to minimize such problems, or at the very least to prevent them from becoming worse.
References
1. Given the low price elasticity of demand for gasoline, a 2% imbalance could easily result a 25% change in short term prices. The price changes resulting from market imbalances are more severe and last longer as a result of the increased rigidities in the infrastructure caused by differences in gasoline specifications in different parts of the US. These make it difficult for product to move freely from low-priced to high-priced markets.
2. Although Virgin Islands gasoline exports recovered quickly, this was not the case for Venezuela where refining operations continued to be restricted. In 2002, the US imported about 44,000 b/d of finished gasoline from Venezuela on average. During January-April of this year, imports averaged only 14,000 b/d and, as of May-July, only 28,000 b/d. The losses were particularly important because Venezuela is a prime supplier of RFG, the product most in short supply over the summer.
3. For the year through August, US crude imports averaged about 9.5 million b/d, of which 1.8 million b/d were from Saudi Arabia. The US total was up by 5% or 470,000 b/d. Imports from Saudi Arabia for the 8 months were up by 340,000 b/d, an increase of 23%.
4. At their low-point for the week ended Aug. 22, stocks were 12% below the year-earlier level.
5. Because of ethanol's affinity for water, gasoline-ethanol blends cannot be transported via pipelines (which sometimes contain water), as is the case with MTBE.
The authors
John H. Lichtblau is chairman and CEO of Petroleum Industry Research Foundation, Inc. (PIRINC). He headed PIRINC as executive director during 1961-90. Lichtblau has served since 1968 on the National Petroleum Council, an industry advisory group appointed by the US Secretary of Energy, and is a member of the Council on Foreign Relations. He also is chairman of PIRA Energy Group. A leading international expert on the petroleum industry and petroleum economics, he has authored a number of publications, has been a frequent witness at congressional hearings on energy policy, and a keynote speaker and lecturer at conferences and seminars. Lichtblau performed his undergraduate work at the City College of New York and graduate study at New York University.
Larry Goldstein is president of PIRA Energy Group and president of PIRINC. He has been a member of the Petroleum Advisory Committee of the New York Mercantile Exchange and a contributor to studies by the National Petroleum Council. He also has served as treasurer of the Scientists Institute for Public Information.
Ronald B. Gold is an energy economist and vice-president of PIRINC and a consulting senior advisor to the PIRA Energy Group, where he writes on oil industry issues and environmental concerns. He is a principal author of most of PIRINC's research reports and directs PIRA's Emissions Market Intelligence Service. Gold retired at the end of 1997 from Exxon Corp. where he was company economist and manager of the Energy Outlook Division for Exxon Co. International. Earlier in his career, he worked for the US Department of Treasury and Office of Tax Analysis and was an assistant professor of economics at Ohio State University. Gold received his undergraduate degree from Brooklyn College, City University of New York, and his MA and PhD in economics from Princeton University.
