US energy demand to rebound in 2003 as production slides
US energy demand will increase in 2003 as the much-anticipated economic recovery takes hold. Consumption of petroleum products, natural gas, and coal will grow, while demand for other primary forms of energy is on par with 2002 consumption.
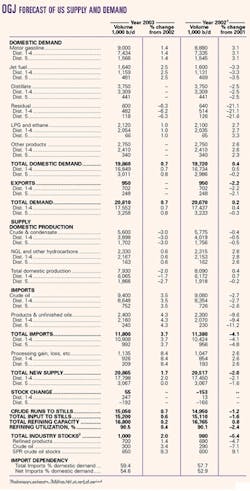
Motor gasoline demand will remain strong, and jet fuel demand will turn around for the first year of growth since 2000.
US production of crude oil and condensate will continue to slide, and imports will rise following a decline last year. Imports will satisfy 59.4% of domestic oil demand vs. 57.7% last year.
Natural gas production will decline as well as the pullback in capital spending further affects output. Meanwhile, demand for gas—especially by the industrial sector—will increase. This combined with a decrease in gas imports will drain gas in storage and put upward pressure on prices.
US economy
Real US gross domestic product (GDP) increased an estimated 2.3% last year following a 0.3% uptick in 2001. The strengthening in industrial production and nonfarm business productivity that began in the middle of 2002 will gain momentum this year. OGJ forecasts that this year GDP growth will be 2.5%.
Since the end of 2001, the Federal Open Market Committee (FOMC) held the federal funds interest rate at 1-3/4% in the belief that such a low rate, coupled with underlying growth in productivity, was sufficient to improve business conditions. Recognizing that the economy needed an additional spur to increase the chances of a robust 2003 recovery, the FOMC lowered the rate half of a point last November. The committee attributed this move in part to greater uncertainty inhibiting spending, production, and employment amid heightened geopolitical risks.
Low interest rates kept the housing market booming, but unemployment increased throughout 2002, fluctuating from an annual low of 5.5% in February to 6% in November. Productivity, however, grew 8.6% in the first quarter, 1.7% in the second, and 5.1% in the third.
Industrial production edged up 0.1% in November for the first manufacturing increase since July, the Federal Reserve reported. The growth was led by an increase in the manufacturing of motor vehicles and parts. Capacity utilization for total industry edged up to 75.6% in November, a level 0.5 percentage points above that of November 2001 and 5.9 percentage points below its 1972-2001 average.
The Conference Board index of consumer confidence increased in November for the first time since May. The index indicates optimism about economic prospects 6 months into the future.
Total energy consumption
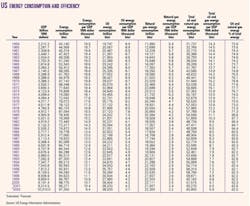
Continued economic recovery and growth in GDP will result in a small increase in 2003 US energy consumption and efficiency.
US demand for energy reached its highest level in 2000 at 98.8 quadrillion btu (quads), then dipped to 96.2 quads the following year and increased 0.4% last year. OGJ expects a 1.2% increase in energy demand in 2003 for total energy consumption of 97.8 quads.
Energy efficiency has improved or been static every year since 1970. With increasing demand, the amount of energy consumed per dollar of GDP has not increased. Last year the US economy consumed 9,370 btu/$1 of real GDP, down from 9,540 btu/$1 a year earlier. OGJ expects efficiency to improve to 9,250 btu/$1 of real GDP this year.
Energy by source
Demand for oil, gas, and coal in the US will increase this year, while demand for all other primary sources of energy are unchanged from last year's levels.
Spurred by a recovery in the economy, gas demand will increase nearly 4% this year following a small 2002 decline. Gas demand during 2002 by residential, commercial, and industrial consumers—as well as electric utilities—declined in the wake of warmer-than-normal winter weather and weak economic conditions. The only primary fuel to increase its market share this year, however, gas will comprise 23% of the total US energy mix.
Consumption of oil will increase less than 1% from last year and lose only a slight amount of its market share. Total oil demand will be 38.8 quads vs. 38.5 quads last year and 38.3 quads in 2001. Increases in motor gasoline and jet fuel consumption will be the drivers for the rise in total oil demand.
Oil and gas will combine to comprise 62.6% of the total US energy market, up from 62.5% the past 2 years. Though it has climbed in recent years, the combined market share of oil and gas peaked in 1972 at 77.7%.
Coal energy consumption will increase marginally and will total 22 quads this year. Coal's share of the energy market will be 22.5%, down from 22.7% the past 2 years.
Total consumption of nuclear power will be unchanged in 2003 following a 1% increase last year. The number of operable nuclear generating units has remained 104 since 1998, but capacity utilization has been on the increase. Capacity utilization reached an estimated 92% last year, up from 89% in 2001, 85% in 1999, and 71% in 1997.
Nuclear energy's share of electricity net generation has also climbed in recent years to 20% last year from a recent low of 18% in 1997. Nuclear power's share of the US energy mix, however, will shrink a bit this year to 8.4%.
A second consecutive year of normal precipitation totals will leave the amount of hydroelectric power use unchanged this year. Energy consumption from hydroelectric power declined 24% in 2001 as a result of drier-than-normal weather in the Northwest.
Other renewable energy sources, including wood, waste, alcohol, geothermal, solar, and wind, satisfy all remaining energy demand. At 6.3 quads, these sources plus hydroelectric will comprise 6.4% of energy consumed in the US this year.
Oil supply
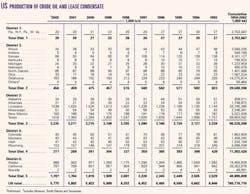
US crude and condensate production in 2002 averaged an estimated 5.78 million b/d, and OGJ forecasts that production will drop to an average 5.6 million b/d this year.
Oil production in the US has decreased each year since 1985. Output in 2001 averaged 5.8 million b/d.
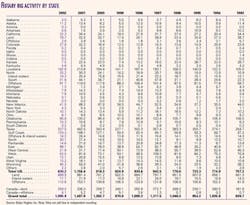
Despite strong oil prices, economic uncertainty has decreased capital spending, and drilling rates reflect that. The Baker Hughes Inc. count of drilling rigs operating in the US last year declined to an average 830 from 1,156 a year earlier. In 2000, the average rig count was 918, up from a low of 625 in 1999.
The number of rigs operating in the Gulf of Mexico also declined last year to an average 109 from 148 the year before. Gas-directed rigs dropped to an average 95 from 118, and rigs drilling for oil fell to an average 14 from 30.
Alaskan oil production—which peaked in 1988 at 2 million b/d—averaged an estimated 988,000 b/d last year, a slight increase from 2001 production. Until 2002, production in Alaska had declined each year since 1991.
Lower 48 production of crude and condensate was nearly unchanged last year at 4.8 million b/d, having declined in most states.
In Texas, output averaged an estimated 1.4 million b/d. Average production in Louisiana declined to 1.5 million b/d. California's production averaged an estimated 770,000 b/d, and in Oklahoma production averaged 183,000 b/d, down from 188,000 b/d a year earlier.
Production of natural gas liquids (NGL) in the US will inch up this year following an increase last year. The 2002 increase was due to extraordinarily weak first quarter 2001 production, as high gas prices made it uneconomical to extract the liquids. NGL production peaked in 2000 at 1.9 million b/d. Strong gas prices this winter will keep output from exceeding that level this year.
OGJ forecasts that total 2003 US production of crude, condensate, NGL, and other liquids will average 7.93 million b/d, a 2% decline from last year's output.
Stocks
Total industry stocks of oil and products at the end of 2002 were an estimated 980 million bbl, down from 1.04 million bbl a year earlier. Crude stocks reached unusually low levels at the end of the year as winter demand and reduced supplies from Venezuela exacerbated a low supply situation.
Weaker-than-normal refinery capacity utilization pressured product inventories to below-normal levels. American Petroleum Institute reported that at the end of November, total US inventories were down 8.3% from a year earlier.
OGJ forecasts that total industry stocks will increase slightly by the end of this year. Crude stocks will be 300 million bbl, and product inventories will be 700 million bbl.
Strategic Petroleum Reserve (SPR) stocks moved up to 600 million bbl from 550 million bbl at the end of 2001 as part of an effort to fill the SPR to its 700 million bbl capacity by as early as 2005. OGJ predicts that SPR stocks at the end of 2003 will stand at 650 million bbl.
Imports
Total US industry imports, excluding oil for the SPR, will climb to an average 11.8 million b/d this year from 11.4 million b/d. Total imports during 2001 averaged 11.87 million b/d.
Rising demand and falling domestic production will lift US oil imports to an average 9.4 million b/d this year. Oil imports dipped to 9.1 million b/d last year from 9.3 million b/d.
Product imports will jump to an average 2.4 million b/d from 2.3 million b/d, but will remain below the 2001 average of 2.54 million b/d.
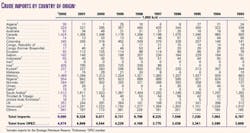
The largest exporter of oil to the US last year was Saudi Arabia, followed by Mexico, Canada, Venezuela, and Nigeria. Iraq was the sixth largest exporter of oil to the US. These were also the top oil exporters to the US, in the same order, in 2001.
The source of the most US petroleum product imports last year was Canada, which was followed by Algeria, the US Virgin Islands, and Venezuela.
The US imported an average 12 million b/d of oil for the SPR last year, OGJ estimates. This compares with 11 million b/d in 2001, and 8 million b/d the previous 2 years. No oil was imported for the SPR during 1995-98.
Refining, prices
US refinery throughput capacity continued to grow last year through incremental additions at existing refineries, and utilization dropped about 3%.
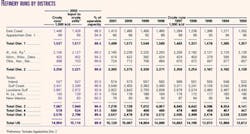
OGJ forecasts that throughput and capacity will increase again this year and that capacity utilization will remain at 90%. Crude runs will average 15.05 million b/d this year, while operable capacity, based on API figures, creeps up to 16.82 million b/d.
US Gulf Coast cash refining margins averaged $2.04/bbl last year, according to Muse, Stancil & Co. Weak margins dominated throughout the first 3 quarters, with the exception of an average $3.05/bbl in March. Otherwise, each monthly average was $2.50/bbl or less. Fourth quarter margins recovered somewhat, averaging $3.31/bbl in October, $2.37/bbl in November, and $2.23/bbl in December.
Geopolitical uncertainties propped up oil and product prices during 2002. A "war premium" caused by the prospect of a US-led war with Iraq added as much as $6/bbl to the price of oil for most of the year, according to some analysts.
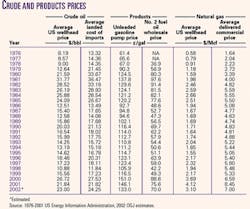
The estimated average price of US wellhead crude oil moved up to $23/bbl from $21.84/bbl a year earlier, while the average landed cost of imports increased to an estimated $24.25/bbl from $21.82/bbl. The average composite refiner acquisition cost of crude oil was an estimated $24.40/bbl compared with $22.96/bbl in 2001.
The pump price of unleaded gasoline declined last year. Warmer-than-normal weather at the beginning of 2002 allowed refiners to move away from the production of heating oil and concentrate on producing more gasoline. Gasoline output in March averaged more than 8 million b/d, the most ever produced during the first quarter, API said. As a result, inventories were plentiful heading into the summer driving season, and prices were relatively stable in the absence of supply disruptions.
Pump prices last year averaged $1.33/gal, down from $1.46/gal in 2001 and $1.51/gal a year earlier. Gasoline taxes at the pump averaged 40.5¢/gal, compared with 40.8¢/gal a year earlier.
Heating oil prices were a little lower last year also, as the wholesale price of No. 2 fuel oil averaged 70¢/gal vs. 75.6¢/gal in 2001 and a recent high of 88.6¢/gal the prior year. The lowest recent annual average wholesale price of No. 2 fuel oil was established in 1998 at 42.2¢/gal.
Oil demand
US demand for oil products will increase less than 1% this year, and exports of crude and products will be unchanged. Demand for motor gasoline and jet fuel will increase, while there is little change in the consumption of other products.
A warmer than normal winter will partially offset the increase in demand garnered from an economic recovery. The National Weather Service's Climate Prediction Center reported that the outlook for January through March is for above normal temperatures over much of the northern US due to the El Nino weather pattern, which will also cause below normal temperatures over the southeast from Texas to Florida.
Precipitation is expected to be below normal in the Pacific Northwest, the northern Rockies, and in the Ohio Valley, due mainly to El Nino. For the same reasons precipitation is expected to be above normal for much of the southern US from California across the Southwest, the southern plains, and the Southeast.
Demand for jet fuel, distillate, and residual fuel oil declined last year in light of the weak economy and warm winter weather. Exports were off more than 2%.
Total 2003 domestic demand and exports are forecast at 20.81 million b/d. Total demand was 20.67 million b/d last year, nearly unchanged from 2001.
Oil-energy consumption has been rising as the amount of oil energy consumed per dollar of GDP—indicating energy efficiency—has been declining. Energy efficiency and oil energy efficiency both improved last year, and OGJ expects that they will do so again this year. Oil-energy intensity is projected to fall to 4,000 btu/$ from 4,100 btu/$ last year.
Motor gasoline
Motor gasoline demand will increase 1.4% to 9 million b/d this year. Demand for gasoline surged following the Sept. 11, 2001 terrorist attacks, and 2002 consumption increased more than 3%. Besides switching away from air travel, stable pump prices and an increase in personal income also contributed to the strength of motor gasoline demand.
Total motor gasoline inventories finished 2002 down 4% from a year earlier. Imports were up 10% annually to 830,000 b/d, while domestic production was 8.45 million b/d, up from 8.3 million b/d last year.
Jet fuel
Demand for jet fuel will move up 2.5% this year following a 2002 decline of 3.3%. Total consumption will average 1.64 million b/d. A return to normal business activity and increasing comfort with air travel will be the impetus behind this boost. In 2000, jet fuel demand reached its highest annual average at 1.725 million b/d.
The Air Transport Association of America, a trade group for US airlines, reported that through November, passenger enplanements for 2002 were down 6% from a year earlier.
While US production of jet fuel remained on par with the year-earlier average, and 2002 imports declined to an average 113,000 b/d from 149,000 b/d, stocks of jet fuel finished the year up 4%.
Distillate, residual fuel oil
Distillate fuel oil demand will remain 3.75 million b/d this year following a 2002 decline of 2.5%. That decline was caused by a lack of fuel switching from gas amid a mild winter as compared to cooler than normal weather in early 2001 and declines in industrial production and transportation.
Demand for residual fuel oil will continue to decline, though at a slower rate than last year. Residual fuel oil demand slid more than 20% last year on higher prices that discouraged fuel switching to relatively cheaper gas and because of a general trend toward gas and away from heavy fuel oil use in electricity generation and industry.
OGJ forecasts that residual fuel oil demand will average 600,000 b/d this year, down from an average 640,000 b/d last year and 811,000 b/d the year before.
Other petroleum products
Consumption of liquid petroleum gas (LPG) and ethane will increase 1% this year to 2.12 million b/d. Demand for LPG and ethane was up 2.7% last year on the attractiveness of LPG as a petrochemical feedstock. Average LPG prices were lower last year than during early 2001.
OGJ projects that demand for all other petroleum products, which include asphalt and lube oils, will be unchanged from last year at 2.75 million b/d. Demand for these products increased 2.5% last year amid robust construction activity.
Natural gas
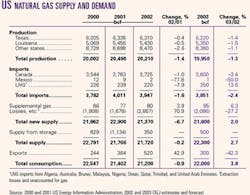
Total US gas consumption will increase almost 4% this year as economic recovery takes hold.
Total domestic supply and imports declined a collective 1% last year as mild winter weather and the weak economy suppressed demand among all consuming sectors.
Gas use among residential, commercial, and industrial consumers, as well as electric utilities, declined the past 2 years, in fact.
Storage levels received most of the attention in the US gas market last year. The amount of working gas in underground storage stood above the 5-year average at the beginning of 2002 and stayed there until the fourth quarter, following production disruptions in the GOM and an early spate of cold weather.
Prices were buoyant throughout the year in spite of depressed demand and plentiful inventories. The average number of gas-directed drilling rigs in the US declined to 691 last year from 939.
In 2002, the New York Mercantile Exchange near-month futures price of gas averaged $3.37/MMbtu compared with $4.07/MMbtu a year earlier. The near-month contract traded at its lowest during January, as closing prices averaged $2.19/MMbtu and its highest during December at $4.84/MMbtu. The average US wellhead price of gas slipped to an estimated $3.10/Mcf for the year from $4.12/Mcf.
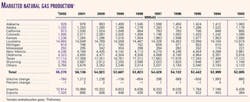
OGJ forecasts that US gas production will decline more than 1% this year to 19.95 tcf. Decreased drilling and capital expenditures, plus climbing decline rates in the shallow waters of the GOM, will combine to reduce output for the second year in a row.
Tropical storms forced the shutdown of production in the GOM in September and again in October. Total US gas production declined last year to 20.2 tcf from 20.5 tcf in 2001.
Imports of gas from each major category of sources declined last year. The amount of Canadian gas the US received in 2002 was reduced because of decreased US demand. The amount of gas imported from Mexico shrank because of a rise in Mexican demand. And LNG imports remained at a reduced level—especially during the first quarter—following Sept. 11 and a rise in security concerns.
Gas imports will decline more than 2% this year as a result of natural decline rates in the northern Rockies of Canada and even less gas crossing the border from Mexico. LNG shipments to the US will be stronger, though, especially in the first quarter. OGJ expects LNG imports to total 250 bcf, an increase of 30 bcf from last year.
Gas exports will decline following a large increase in 2002. Last year's US storage build-up allowed from an excessive amount of gas to be sent to Mexico, where it was in greater demand.


