LOUISIANA HAYNESVILLE SHALE—2: Economic operating envelopes characterized for Haynesville shale

View Article as Single page
A horizontal well severance tax exemption applies to any well or any horizontal recompletion where production commenced after July 31, 1994. All severance tax on a horizontal well is suspended for a period of 24 months or until payout of drilling and completion cost is achieved, whichever comes first.
Property tax is assessed on surface and subsurface equipment according to depth brackets based on the uppermost producing interval of the well. Millage rates usually vary from $75 to $150 per $1,000 of assessed value. Property tax is not considered.
All capital expenditures occur in the year of first production, and we apply midyear discounting using a discount rate that ranges from 8% to 20%.
The percentage of intangible (expensed) to tangible (capitalized) cost is unknown and assumed to range from 40% to 60%. There are many lives of equipment, ranging from 3 to 25 years, and either 150% or 200% declining balance may be used depending on the life of the asset. We have used 150% declining balance over a 5-year time period as an average.
Wells are abandoned at the economic limit of 90 Mcfd or when the reservoir pressure declines to the point where the cost of compression is no longer economical. Abandonment cost is not considered.
Analysis is performed before and after federal income tax. Federal income tax is levied on gross revenue less royalty, operating costs, dry hole costs, intangible development costs, depreciation of other exploration costs, and tangible development expenditures. We do not consider depreciation of leasehold acquisition costs or G&G expenses. Losses may be carried forward for a maximum of 10 years. Federal tax rate is assumed to range from 35% to 50%.
Two-factor model
Discounted before and after cash flow analysis is performed on average production profiles for 6-24 month vintage Haynesville wells (Fig. 1) for the range of input parameters summarized in Table 1.
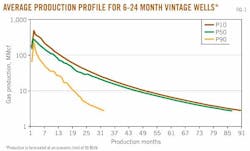
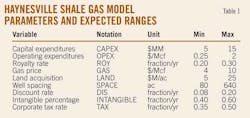
P50 is the base (average) case and P10 (optimistic) and P90 (pessimistic) represent the expected bounds for the range of well performance. The input variables include capital expenditures (CAPEX), operating expenditures (OPEX), royalty rate (ROY), acreage cost (LAND), land spacing (SPACE), discount rate (DIS), intangible percentage of drilling and completion cost (INTANGIBLE), and corporate tax rate (TAX). The output variables are NPV and IRR.
P10 curves obviously yield the most favorable economics and P90 the least favorable, and the scale of these differences provide an indication of the range of results and the potential investment risk.
Also, before-tax analysis will yield more favorable results relative to an after-tax assessment and both are presented for comparison.
Tax on income is difficult to evaluate without detailed information and is usually considered to have a modest impact on development decisions. The nature of tax assessment is uncertain and our ability to capture subtle aspects is limited.
Displaying 3/5
View Article as Single page