Method improves detection of subsea pipeline insulation damage
Wenlong Jia Zhuoran Li Kexi Liao
Southwest Petroleum University
Chengdu, China
A new method based on temperature differentials has improved detection of damaged insulation in subsea pipelines carrying high-viscosity crude oil. High-viscosity crude travels in subsea pipelines at a temperature far higher than the surrounding water temperature. Reducing heat transfer and saving energy requires the pipe be insulated. Damage to the pipe protecting the insulation, however, will make it wet, increasing heat flow from the pipeline. Such damage is difficult to detect.
This article proposes an easy method for finding damaged insulation and successfully applies it to an operating pipeline in the South China Sea.
Basic data
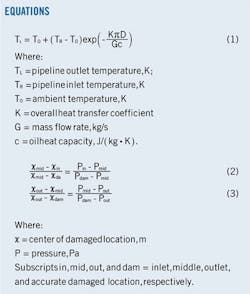
The Sukhov formula (Equation 1) can calculate the pipeline's temperature. Its outlet temperature increases with flow rate. If the temperature distribution violates this tendency, the insulation may be damaged. But its location still must be determined.
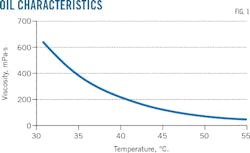
Fig. 1 shows the oil viscosity-temperature curve of a 26.2 km, 11.6-in ID subsea pipeline in the South China Sea. Viscosity increases sharply when the temperature is lower than 40° C., requiring the pipeline to operate above this level to reduce pressure drop. An ambient winter seawater temperature of 6° C. requires insulation and an outer shield pipeline. Table 1 shows heat transfer properties of the resulting four-layer pipeline.
Table 2 shows five sample inlet and outlet temperatures and pressures taken from the pipeline. Sample No. 5 had outlet temperature decreasing with increasing flow rate, deviating from Sukhov's formula and suggesting the insulation may be damaged.
Method
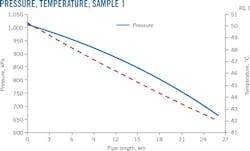
To find the damaged insulation we built an oil pipeline simulation model based on SPT OLGA software. Inlet pressure, inlet temperature, and outlet mass flow rate were set as boundary conditions to calculate the outlet pressure and temperature. The pipeline's overall heat transfer coefficient, K, is a critical variable reflecting the insulation's integrity. It can be inversely calculated by adjusting its value until the calculated outlet temperature equals the real values. According to Table 1, the K values for Samples 1 to 4 = 0.32 w/(sq m·K). Fig. 2 shows the calculated pressure and temperature curves along the pipeline.
The inverse-calculated K value for Sample 5 = 0.91 w/(sq m·K), significantly higher than normal and an indication that insulation has been damaged. Assuming the damaged insulation's heat transfer properties are equal to water's yields a K value of 5.1 w/(sq m·K), used in the simulation model as the damaged section's heat transfer coefficient.
Research showed outlet temperature had little correlation to the damaged pipe's length. Length, therefore, can be obtained by adjusting its value until the outlet temperature equals the real value.
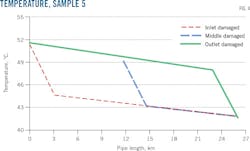
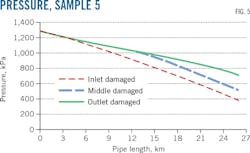
With the pipeline's temperature used to calculate damaged length, pressure distribution is used to determine the damaged location. Whether the damaged insulation is in the inlet, middle, or outlet of the pipeline (Fig. 3), the simulation model can calculate pressure and temperature distributions along its length. Fig. 4 and 5 show the resulting temperature and pressure curves, respectively, for Sample 5.
Fig. 4 shows three outlet temperatures that are nearly identical even though the damaged locations are different. Fig. 5 shows the outlet pressure as dependent on the damaged location. Pressure is highest when the pipeline outlet is damaged and lowest when it's the pipeline inlet that gets hurt. The oil's temperature-viscosity relation contributes to this difference.
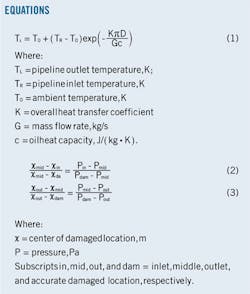
The three outlet pressures shown in Fig. 5 can be used to find the accurate damage location via linear interpolation. If the damaged location is between the inlet and middle of the pipeline, Equation 2 calculates it. Otherwise, the location is calculated by Equation 3.
Fig. 5 shows the pipeline's three outlet pressures as 709 kPa, 509 kPa and 379 kPa, with different damage locations. The center locations for the damaged pipe sections are 1.58 km, 13.1 km and 24.63 km. The pipeline's real outlet pressure in Sample 5 is 402 kPa. Substituting these values into Equation 3 puts the center-of-damage location at 20.9 km.
Verification, analysis
Simulation results provided the data needed to guide operation of a remotely operated vehicle used to verify the damage location on the actual pipeline. Two damage points were identified-one at 19.7 km and one at 20.6 km (Fig. 6)-and the wetness of the insulation verified. The later was very close to the derived 20.9 km site, showing the method's utility in finding insulation damage to subsea high-viscosity crude pipelines.
Acknowledgment
This paper was financially supported by the National Natural Science Foundation of China (No. 51474184) and the Research Project of the Education Department of Sichuan Province (No. 20125121110003).
The authors
Wenlong Jia ([email protected]) is a lecturer at Southwest Petroleum University (SWPU), Chengdu, China. He earned his Ph.D (2014) from SWPU. His interests lie in oil and gas pipeline simulation.
Zhuoran Li ([email protected]) is studying for his MS degree at SWPU. He earned a BS (2015) in petroleum engineering from SWPU.
Kexi Liao ([email protected]) is director of the oil and gas storage and transportation department at SWPU and is also a professor at SWPU. His interests lie in pipeline integrity management.
