Whiting's geoscience team uses electron microscopes to determine shale play potential
Whiting Petroleum Corp. depends upon an elaborate rock imaging and analysis laboratory at its downtown Denver offices to help evaluate plays. Recently, lab results helped steer the independent toward the Three Forks potential of their Dunn County Charging Eagle area.
"We think it gives us a competitive edge," said Lyn Canter, senior geoscience advisor who manages Whiting's rock laboratory.
Using UV lights to first evaluate core samples, Canter said Charging Eagle cores showed promise.
"We evaluate it for brightness. Nice light hydrocarbons flouresce a sort of brilliant lemon yellow. The duller the cores, the less confident we are on production. When we looked at the Three Forks, we realized this was saturated and a great objective," Canter said.
She noted that few companies, especially independents, have their own in-house digital imaging tools.
Some independents sent their core samples to service companies or university labs and then have to wait weeks for test results.
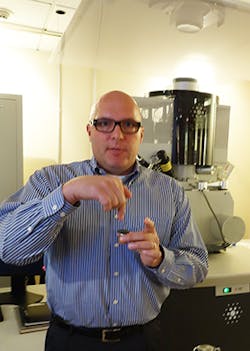
Canter said Whiting in 2011 bought two scanning electron microscopes, an environmental SEM and a duel-beam SEM, that are used to evaluate slivers of rock from core samples. Images of the slivers are magnified, providing lab technicians with images that appear three dimensional using computer programs.
SEM analysis provides details from tight-oil formation core samples that cannot be obtained using conventional core-testing methods, she said. Lab findings help Whiting executives and geologists decide quickly whether to drill in a particular location while the rig remains on location in the field.
Subtle gray-scale variations within the magnified sample provide crucial information in analyzing the samples, she said. A sample projected onto a computer monitor shows pores as dark gray to black, pyrite showing up as white areas, while clay, quartz, and feldspar show up as medium gray areas.
Using observations of rock microstructures, Canter and others, including petrographer/sedimentologist Dave Katz, calculate measurements in nanometers to determine the size of pore throats, which are gaps between grains in the rock. The width of those gaps control permeability, which determines whether oil or gas can flow.


