Nelson-Farrar Quarterly Costimating: Nonmetallic building materials lead index changes
Gary Farrar
Contributing Editor
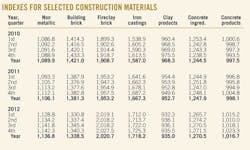
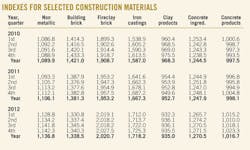
The accompanying table shows how Nelson-Farrar indexes have changed over 2010-12, for selected basically nonmetallic building materials.
Data are included for the overall nonmetallic group, five nonmetallic materials and iron castings.
Fireclay brick and iron castings indexes showed the greatest changes during the period.
Iron castings, showing the greater gains of the two, changed to 1,725.3 in fourth-quarter 2012 from 1,538.9 in first-quarter 2010. Fireclay brick changed to 2,027.5 in the fourth quarter from 1,899.3 in the first quarter of the period tested.
Concrete ingredients and concrete products showed more moderate changes, although no change in the indexes was drastic. The concrete ingredients index rose to 1,271.5 from 1253.4 over the 3-year period. During the same period, concrete products changed to 1,023.3 from 1,000.6.
Two decreasing index changes occurred in the clay products and building brick categories. Clay products changed to 935.5 in fourth-quarter 2012 from 960.4 in first-quarter 2010. Building brick changed to 1,340.3 from 1,414.3 during the period.
The final category, the overall nonmetallic index, changed to a high of 1,142.3 from 1,086.8 during fourth-quarter 2012.


