Clarifying GOM decom costs-2: Method reveals benchmarks for decom market valuation, risk
Mark J. Kaiser
Center for Energy Studies
Louisiana State University
Baton Rouge
Decommissioning in the Gulf of Mexico (GOM) is a specialized market. It is also small relative to regional upstream spending, with capital expenditures of about $1-2 billion/year compared with $30-50 billion.
The market is not large enough for annual surveys such as the American Petroleum Institute Joint Association Survey for well cost. And benchmarking studies are rarely performed or warranted because decommissioning is a relatively simple operation in most cases-basically only the reverse of installation after plugging all the wells.
Decommissioning activities, however, are important to several stakeholders in the region, including the federal government that regulates the sector, and cost statistics are necessary to evaluate the market and determine supplemental bonding levels and decommissioning-risk metrics.
The first part of this series introduced a new method to estimate decommissioning cost in the GOM with settled-liability data (OGJ, Dec. 1, 2014, p. 70). This second and concluding part applies the method and highlights results.
Using settled-liability data from 17 public companies with operations primarily in the Gulf of Mexico allows the average cost to decommission a structure in the GOM during 2008-12 to be estimated at $6.4 million in water less than 200 ft deep and $15.6 million in water deeper than 200 ft.
This article also introduces a new market index to track GOM decommissioning activity and concludes with a discussion of the limitations of the analysis.
Top-down, bottom-up approaches
Throughout every sector of the oil and gas industry, from exploration through decommissioning, cost estimates are required in a wide variety of applications.
Cost studies are notoriously difficult to perform, however, because companies may not be interested in participating. If a willing party is identified, the collected data will only reflect the company providing information and may not represent the industry sector or the activity the analysis is trying to inform.
Management may be reluctant to make information public in the interest of protecting a perceived competitive advantage. Evaluating job reports when they are made available is frequently tedious and time consuming.
Many service and equipment providers win work based on being the low-cost bidder, and if other firms know how the company prepares its bid and markup, even on an average basis, it could be at a competitive disadvantage.
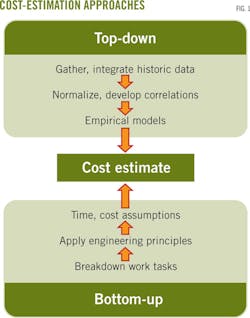
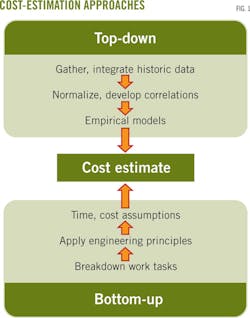
Two basic methods of cost estimation employed in industry are commonly referred to as the "top-down" and the "bottom-up" approaches (Fig. 1).
The top-down approach uses historical data and normalizes projects by type, size, complexity, and other factors using statistical methods and regression models to estimate the cost for "similar" current projects.
In the bottom-up approach, the work of a project is broken down into discrete and identifiable units, and the costs of each unit are estimated with engineering principles and expert judgment.
The unit costs are added together, often with contingencies, to yield the cost estimate.
Using settled-liability data to estimate decommissioning costs avoids the problems associated with the usual hit-or-miss nature of data collection.
Settled-liability data also provide audited data across a potentially wide spectrum of the industry and, even for modest samples, results are expected to be broadly representative.
The procedure is novel because it avoids the complications and potential bias associated with operator surveys and does not require company participation.
It is repeatable because it is based entirely on public data. It requires extensive data processing in normalization, however. As with all empirical studies, there are trade-offs to manage.
Proved reserves
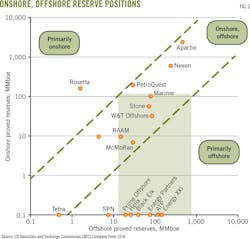
Seventeen public companies with operations in the US GOM were identified according to their onshore and offshore reserves on Dec. 31, 2012 (Fig. 2).
Public companies are required to disclose proved reserves and production according to US Security and Exchange Commission (SEC) guidelines.
Annual reports are available on Form 10-K, quarterly reports on Form 10-Q, and current reports on Form 8-K on company websites as well as the SEC's EDGAR (electronic data gathering, analysis, and retrieval) database.
Subsidiaries of a subsidiary, which are de facto 100% controlled by the parent company, may not be recorded. (See accompanying box.)
Adjusted settled liability
Settled-liability data were collected and adjusted for sales transactions during 2008-12 (Table 1). Adjusted settled liabilities for the sample companies varied from $429 million in 2008 to $1,032 million in 2012.
If settled-liability data cannot be adjusted, their inclusion will bias results, possibly significantly. For example, in 2008 and 2009, Apache Corp. reported $587 and $508 million, respectively, in settled liability, but its sales transactions were not reported. Rather than include such data without normalization, we excluded it in this analysis.
Decommissioning activity
Well abandonment, and structure removals in the GOM were identified with the Bureau of Ocean Energy Management (BOEM) borehole, platform, and structure databases with data reported in January 2014. Working interest positions for structures and wells were tabulated on an annual basis from 2008-12.
In 2008, the sample companies plugged 347 wells and decommissioned 36 caissons and well protectors and 27 fixed platforms. In 2012, 636 wells were plugged and 83 caissons and well protectors and 64 fixed platforms were decommissioned.
The sample companies decommissioned 28% of structures and 31% of wells in the GOM during 2008-12. Not all companies decommissioned structures every year, and several small companies performed no activity. Additionally, there were many companies entering and leaving the region during this period. (See accompanying box.)
Average cost
In 2008, the average aggregate cost to remove a structure and plug its wells was $13.0 million (Table 2). In 2009, the average aggregate cost/structure was $8 million; in 2010, $10.7 million; in 2011, $7.4 million; and in 2012, $7.1 million.
Average decommissioning cost in 2008 was higher than other years, due in part to hurricane damage and destruction from Hurricanes Gustav and Ike, and the higher dayrates for marine vessels arising from the sudden demand for services during the year.
Wide variation exists between companies' annual decommissioning expenditures and the difference between the average low and high cost.
During 2008-12, structure decommissioning costs averaged $8.4 million, and in recent years, average costs have declined due to moderating vessel demand and the completion of most hurricane clean-up (OGJ, Apr. 2014, p. 70).
During 2010-12, average structure-decommissioning cost was $8 million. From 2011-12, it was $7.2 million.
Well-structure correlation
There are reasons to distinguish between well abandonment and structure removal because each activity contributes to total decommissioning expenditures.
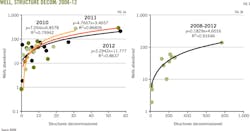
Because the operations tend to be correlated (Fig. 3), however, inclusion of both variables in regressions needs to be performed carefully because they will likely lead to over-specified models.
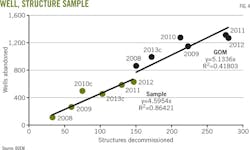
On average, operators abandoned 4.6 wells for every structure removed, compared with 5.1 wells GOM-wide (Fig. 4). Decommissioning for the sample companies broadly reflect GOM activity trends.
Operator cost
During 2010-12, Apache Corp. spent $1.1 billion on decommissioning. During 2008-12, McMoRan Exploration Co. spent $440 million on decommissioning, followed by W&T Offshore Inc. ($420 million), Tetra Technologies Inc. ($393 million), Stone Energy Corp. ($296 million), and Energy XXI Ltd. ($280 million).
Apache plugged and abandoned 764 wells and removed 145 structures during 2010-12, while Energy XXI abandoned 119 wells and removed 46 structures.
The average cost for Apache to plug and abandon wells and remove structures was $7.4 million/structure.
The average for Energy XXI was $6.1 million/structure (Table 2).
High costs indicate larger structures in deeper water with large well inventories, hurricane destruction, and increased market demand for vessels at the time of operation, among other factors.
For example, Mariner Energy took on high costs from decommissioning hurricane-destroyed infrastructure during the period.
Companies with less activity are also more sensitive to small variations in data and may occasionally report unusually high cost.
For example, Energy Partners in third-quarter 2013 and Nexen in 2009.
This data must be interpreted carefully because it may represent data-processing bias.
Well abandonment
Regression-model results for decommissioning costs normalized on a wellbore basis are computed as $1.5 million/well during 2008-12, $1.7 million/well 2010-12, and $1.6 million/well during 2011-12 (Table 3).
Therefore, a well protector with two wells would have an expected decommissioning cost of $3-$3.4 million, while a fixed platform with five wells would be expected to cost $7.5-$8.5 million to decommission.
Structure decommissioning
Under the same adjusted settled-liability data, the average cost to decommission a structure with its well inventory has declined to $7.2 million during 2010-12, and $6.8 million during 2011-12, from an estimated $7.5 million during 2008-12.
The regression-model results are modestly lower than the arithmetic average cost of $8.4 million, $8.0 million, and $8.2 million, respectively (Table 2).
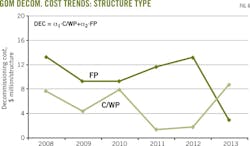
Fixed platforms are three-to-ten times more expensive to decommission than caissons and well protectors. Caisson and well protector decommissioning cost was $3.5 million and fixed-platform removal cost was $11.2 million from 2008-12 (Table 3). In recent years, decommissioning simple structures has cost less and fixed platforms more, from $1.3-2.0 million for a caisson and well protector to $13.4-14.2 million for a fixed platform.
Caissons and well protectors only hold a few wellbores, often no more than three, while fixed platforms often hold several wells at decommissioning. Structure-decommissioning cost reflects higher well counts and the higher cost of decommissioning fixed platforms in deeper water.
Wells abandoned, structures decommissioned
Two variable models allow us to distinguish average cost by activity but are not always valid across all time periods or model formulations. Inclusion of an abandoned-well variable with structures decommissioned degrades the model results, and in several years, the coefficients are no longer significant. During 2008-12, average abandonment cost/well was $600,000, and average decommissioning cost/structure was $4.7 million (Table 3).
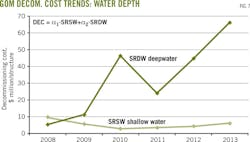
In that same period, structures decommissioned in shallow water cost $3.9 million, and in deepwater, $35.2 million (Table 4). In recent years, shallow-water structures have cost less to decommission, $3.3-4.2 million, compared with deepwater structures of $41-$47 million.
Adding a well variable to shallow and deepwater fixed platforms suggests well abandonments cost $500,000 to $1 million/well in the presence of this variable.
During 2008-12, caissons and well protectors cost $3.8 million to decommission, while shallow water fixed platforms cost $9.6 million. Deepwater structures cost $17.4 million. Average shallow water cost has decreased in recent years, while average deepwater cost has been $25-$43 million.
Market index
Regression-model coefficients reflect market activity.
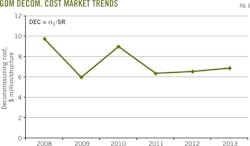
The one-variable and two-variable models in Tables 3 and 4 are plotted in Figs. 5-7.
Average decommissioning cost provides a useful metric to characterize industry trends in the region and can serve as a GOM decommissioning market index.
Limitations: state properties
There are limitations to this analysis that are important to understand when interpreting the model results.
Companies that produce offshore in the Gulf of Mexico may operate or own state water, federal water, and onshore properties.
Decommissioning spending occurs for all properties owned, whereas the processed data only include activity in federal water.
Decommissioning onshore is much less expensive than in federal waters, and its exclusion is not believed to be a source of major error.
Companies with properties in state waters were not common in the sampled set. Onshore property impacts also are not considered significant.
Operating basins
Settled liabilities refer to all decommissioning activity and sales for all properties worldwide. Majors and large independents operate across multiple geographic regions around the world, while most smaller independents typically specialize domestically either onshore or offshore.
If a company operates in more than one region, it will be difficult and in many cases impossible to assemble decommissioning activity and property sales across all operating basins.
Companies that have most of their production and reserves in one region require minimal data adjustment, while companies that operate and produce onshore and offshore require more adjustment.
Settled liability data from companies that operate in multiple domestic and international regions require significant adjustments and are likely to introduce substantial error without careful normalization and processing.
Restricted investments
Normally, when properties are bought or sold, the ARO liabilities are transferred, but special arrangements for the parent to hold on to the ARO or to pay for a negotiated share of decommissioning liability at a later date may be made, which will distort the data.
Royal Dutch Shell, for example, made special arrangements with Superior Energy Services regarding future decommissioning activity when it sold its interest in the Bullwinkle platform.
A company may increase its working interest ownership in a property for the assumption of a greater share of future abandonment liability, and these cases are difficult to identify and quantify.
Reporting period
Most companies employ a fiscal period that ends Dec. 31, but some companies employ a period that ends June 30.
A calendar-year assessment is the most convenient for matching settled liability with activity data, and for companies that employ the June 30 period, the settled liability data need to be normalized to be consistent with the calendar year basis.
Normalization will introduce error in the assessment, but because only one company in the sample (Energy XXI Ltd.) used a June 30 fiscal period, the impact of the normalization in the evaluation was not large.
Company size
Small companies perform a small amount of decommissioning work infrequently, while larger companies are more active, more regularly. Small and less frequent activity is more likely to introduce error in the assessment, since data reporting and processing errors are likely to be magnified.
Hurricane clean up
Unconventional decommissioning projects occur over multiple years and contribute to settled liabilities during the period but activity is not registered as completed until the conclusion of the operation.
For conventional operations, decommissioning is expected to correlate with liabilities settled during the period. If unconventional work has occurred, expenditures made during the reporting period will not translate into measurable activity until later.
Therefore, activity performed will appear more expensive relative to conventional decommissioning.
Sales transactions, working interest
Sales transactions and reductions in working interest may or may not be reported with estimates of settled liabilities.
If sales transactions are large and reductions in settled liabilities are not performed, using settled-liability data will bias the results during the period of analysis.
If sales transactions are low, they are unlikely to play a major role and can be safely ignored.
Well abandonment and structure removal are unambiguous. Ownership positions, while also unambiguous, require additional processing to estimate and are prone to processing error.
There are more owners than operators, and wells may have different owners than structures. In some cases, the aliquots employed to determine working interest may be incorrect or improperly calculated. This can lead to error in activity counts.
Additionally, ownership positions change over time, sometimes dramatically, which requires advanced processing to track.
Other decom activity, private-equity firms
Many activities occur in decommissioning, including pipeline abandonment and site clearance and verification.
It is possible that one or more of these activities will play a major role in total project cost.
Additional variables could be compiled and added to the models, but the inclusion of variables outside those examined probably are not relevant.
In recent years, a number of private-equity firms have entered the GOM and purchased significant assets as public companies exit the region.
Private companies are not subject to SEC regulations.
Data availability will decline in the future, which may impact cost-estimation updates.
Mitigating uncertainty
Public information from adjusted settled liabilities and company decommissioning was used to infer private data on average decommissioning cost.
There are many potential sources of uncertainty when public data are used to infer private information.
Careful normalization and processing, judicious use of variables, and understanding the intricacies of the sample data can mitigate and control for most of the issues.
Period highlights
During 2008-13, Tetra Technologies Inc. wound down their subsidiary Maritech Resources and left the region. ATP Oil & Gas Corp. declared bankruptcy. A new company, Prime Offshore, entered then left the market.
Apache Corp. acquired Mariner Energy Inc. in 2010 and in 2013 announced the sale of all GOM shelf assets to Fieldwood Energy LLC, an affiliate of Riverstone Holdings LLC, for $3.5 billion and the assumption of $1.5 billion in asset retirement obligations (ARO). Apache then left the region.
W&T Offshore Inc. acquired most of Callon Petroleum Co.'s offshore properties, which left the region in 2012.
While Energy XXI Ltd. was going on an extensive buying spree, McMoRan Exploration Co. was selling most of its offshore properties.
In 2012, Helix Energy Solutions Group Inc. closed on the sale of Energy Resource Technology GOM Inc. to Talos Energy LLC for $620 million, and FreePort-McMoRan Copper & Gold Inc. announced the acquisition of McMoRan Exploration Co.
Nexen Inc. was acquired by the China National Offshore Oil Corp. (CNOOC) in 2012.
The author
Mark J. Kaiser ([email protected]) is professor and director, research and development division, at the Center for Energy Studies at Louisiana State University. His primary research interests are related to cost, fiscal, and regulatory studies in the oil and gas industry. Kaiser holds a PhD in engineering from Purdue University.
