Innovative 3D visualization tool promotes development-drilling efficiency
In today's upstream exploration and production industry, companies are placing much greater emphasis on improving collaboration between asset teams to more efficiently evaluate economics and risk factors involved in prospect development.
To achieve optimal results, collaboration and multidiscipline, real-time integration must encompass all phases of the oil field life cycle, which begins at the planning stage and continues through well construction and eventual production.
For quite some time, geoscientists have enjoyed the benefits of visualization systems, which make efficient use of integrated data.
Under these conditions of optimized workflows, geologists and geophysicists have built better earth models resulting in a better understanding of the subsurface.
Seldom do drilling engineers reference the earth model, which the geology and geophysical team members developed. This chasm between the explorationists and drillers can and does impact the wellbore planning and construction.
Clearly, with two camps working almost independently of each other, opportunities exist for improvement in overall operations.
This particular scenario is a perfect opportunity for integrating drilling operations with knowledge about the earth model, in real time, to obtain the best possible results.
The advent of real-time 3D drilling event visualization software late last year in combination with the earth model enables asset teams to make rapid, accurate decisions better than before. Major benefits resulting directly from 3D drill ing event visualization are:
- Well planning in a 3D earth model.
- Integrated 3D environment for collaboration between drilling engineers, geoscientists, and petrophysicists.
- Unique collaboration between the office and rig site.
- Direct comparison between well plan and actual wellbore, with data interpretation and analysis in real time.
- Access to vast data stores for integrated earth model and drilling operations data.
- Knowledge management during drilling operations, reviewing past incidents and preparing contingency plans in the context of the earth model.
3D visualization tool
Today's powerful PCs and laptops make visualization tools available not only to geoscientists but to drilling engineers as well.
Geoscientists have traditionally enjoyed the benefits of advanced visualization tools running on UNIX operating systems. However, such systems do not lend themselves well to drilling engineers at the well site.
To meet the needs of both the geoscientists and the drilling engineers, Landmark Graphics Corp., Houston, introduced a 3D visualization tool, which they call 3D Drill View.
Released in 2001, the PC-based software is designed for drilling engineers, geophysicists, geologists, petrophysicists, and other asset team members involved with the drilling domain. It provides the capability for use both in the office and at the drillsite, offering real-time integration and collaboration between the two environments.
In the context of the earth model, the 3D visualization software enables:
- Collaborative well path planning.
- Real-time integration, visualization of measurement-while-drilling (MWD) and logging-while-drilling (LWD) data.
- Integration of drilling operational events.
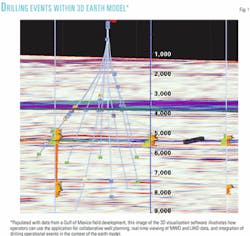
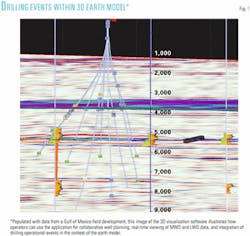
Operators in the Gulf of Mexico, the North Sea, and onshore Latin America have drilled wells and proven the technology, which Landmark and Sperry-Sun Drilling Services, had pioneered (Fig. 1).
These projects involved collaborative well path planning in the context of the earth model, correlating planned vs. actual comparisons of real-time MWD and LWD data from the drilling location to validate and update the earth model.
Well path planning
Sincor, an operating company owned by TotalFinaElf SA, Petroleos de Venezuela SA (PDVSA), and Statoil ASA, successfully implemented a collaborative well planning and real-time decision support system in the field.
The system was built around Halli burton Sperry-Sun's INSITE to OpenWorks link, which is key to the real-time component of the 3D Drill View system.1 INSITE is Sperry-Sun's networked rigsite information system, and OpenWorks is Landmark's E&P project data management system.
Operating in the Zuata area of Venezuela's Orinoco heavy oil belt, Sincor obtained exceptional results and, for the first time, was able to integrate logging-while-drilling information from the rigs with the geologic model in the office, making critical well path changes in real time.2
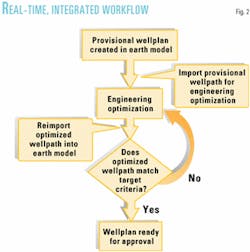
The real-time integrated workflow began in the operator's offices (Fig. 2). Sincor typically drills the exact same arrangement of horizontal wells in every cluster, with the well targets based on 3D seismic and wireline data obtained from vertical wells.
After interpretation, the operator sets horizontal drains in the best portion of each pay zone. The secret to success is maximizing percent sand cut in each horizontal drain while staying away from underlying water and overlying tar-filled sands, thereby minimizing costly sidetracks.
The operator's engineers and geoscientists used the collaborative well planning system facilitated by the software applications, with geoscientists choosing targets directly in their 3D seismic interpretation software.
Engineers generated initial directional wellbore plans automatically within the 3D earth model.
Those data were then exported to a more rigorous path planning and analysis package where engineers optimized the trajectory before exporting them back to the seismic application for visualization and approval. Iterations were extremely fast and efficient.
Real-time decisions
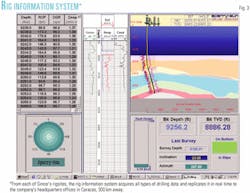
The operator equipped each of its drilling rigs with the INSITE system, which acquires and stores all types of real-time drilling data, e.g., pump rates, standpipe pressure, rpm, torque and drag, depth, azimuth, and inclination as well as LWD measurements (Fig. 3).
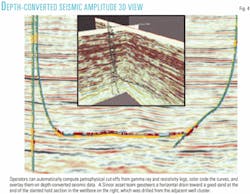
To determine whether the drill bit is penetrating sand or shale, oil or water, the operator automatically computed a set of petrophysical cutoffs from the gamma ray and resistivity logs and color-coded the curves accordingly.
These curves were then overlaid on a depth-converted seismic cross section or 3D view with either amplitude or acoustic data (Fig. 4).
Using this system, the operator was able to prepare more than 20 directional plans/day, update the geological database with LWD data every 2 minutes, guide the drill bit to maximize sand cut in horizontal sections, and minimize costly sidetracks.
The successful use of this system effectively yielded a substantial increase in production rates.
Correlating real-time data
To illustrate some of the gains that can be achieved in the well construction process through improved use of available data from the wellbore and the rig site, BP PLC conducted a case study in the Gulf of Mexico.3
With trial runs throughout the 121/4-in. interval of the Holstein appraisal well, the study demonstrated how company personnel could successfully correlate real-time logging-while-drilling and directional data with the predrill seismic model and then use the correlation to select a critical casing point.
While drilling the well, discrepancies between the well log and seismic data became apparent, within a critical section of the well path. The bottomhole assembly did not encounter an expected key marker bed, to be used in selecting a casing point, at the anticipated depth.
This casing point was critical, as the operator expected overpressured sands below the marker bed. This led to some uncertainty in the time-to-depth conversion of the seismic model.
Based on the real-time information, the asset team recommended that drilling continue, and the marker bed was subsequently encountered 300 ft deeper than expected.
The operator set casing at the revised depth.
Geoscientists updated the seismic model, and the overpressured sands were drilled without further incident.
The final results could have been much different if the casing had not been set 300 ft deeper or an incorrect interpretation led to the unplanned penetration of the overpressured zones.
The asset team's recommendation, however, resulted in potentially saving the operator millions of dollars in rig time, tubular costs, and other expenses.
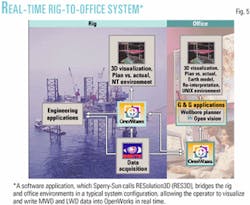
Playing an integral part in the success of the operation, the operator employed a software application, which Sperry-Sun calls RESolution3D (RES3D), to bridge the rig and office environments.
The system provided the operator with the ability to visualize and write MWD and LWD data into OpenWorks in real-time. Fig. 5 illustrates a typical system configuration.
Integrate drilling events
The ability to display drilling operational information in the 3D earth model along with geophysical or geological data has only recently become available to the industry, with the introduction of 3D drilling event visualization software.
The application uses data stored in OpenWorks and DIMS, displaying historical drilling operational information in the context of the earth model.
The application allows teams to visualize drilling events and review trends, all of which bring a new aspect to well planning and operational efficiency.4
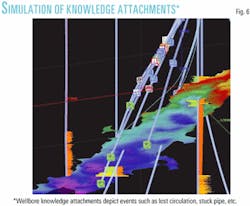
The software automatically places symbols, called "knowledge attachments," on each wellbore trajectory displayed in the three-dimensional environment. Each symbol indicates a specific drilling event or problem (Fig. 6).
The technique proves particularly useful in representing different data at the same time and in such a manner that the interdependencies between the earth model and drilling operations data are evident and correlated.
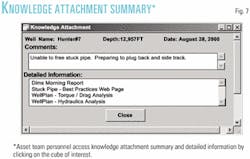
Asset team members can access detailed information bound to a given knowledge attachment simply by clicking on it (Fig. 7).
The asset team of a major operator in the North Sea successfully used the 3D visualization software, which resulted in large time savings in the well planning process, impacting the business process as follows:
- The team experienced sizeable time savings in the planning phase due to the data being brought together one time rather than by multiple individuals within the same team.
- The visual "instant recall" of drilling logs and incidents allowed the team to better manage the risk envelope and allowed for contingency planning.
- The software facilitated the sharing of well challenges and objectives with the entire team.
- Well planning teams experienced less repeated work, and the information was held at a central location, making it available for future well planning teams.
- The system captured the plans and lessons in one location, making them available to both subsurface and drilling staff working on a particular well or field.
This new solution provides asset teams with an innovative tool, giving them a common integrated environment for reservoir development projects.
Through each step of the well design process, into operations, and finally post well analysis, asset team members can share a learning environment that assists the team in making better-informed decisions in a shorter time frame, impacting the overall project success.
The use of 3D drilling event visualization software provides a powerful means for both engineers and geoscientists on an asset team to integrate and visualize the subsurface earth model, LWD and MWD, and drilling operational data in real-time.
References
- "SINCOR Integrates Drilling Data with Earth Model in Real Time," Landmark Solutions in Action.
- Branch, A.J., Andersen, K., Lavillonniere, J.L., Larsen, T., Kremer, Y., and Capacho, G.A., "Real-time Well Construction Monitoring - A Case History of Sincor's Heavy Oil Project," SPE 67757, presented at the SPE/IADC Drilling Conference, Amsterdam, Feb. 27-Mar. 1, 2001.
- Marshall, G., Holt, J., Winters, W., and Evans, S., "Relevant Time Update of an Earth Model with Logging While Drilling Data," SPE 62528, presented at the SPE/AAPG Western Regional Meeting, Long Beach, CA, June 19-23, 2000.
- Sanstrom, W.C. and Hawkins, M., "Perceiving Drilling Learning Through Visualization," SPE 62759, presented at the IADC/SPE Asia Pacific Drilling Technology Symposium, Kuala Lumpur, Malaysia, Sept. 11-13, 2000.
The authors
Bill Sanstrom is vice-president of drilling, production, and business management systems for Landmark Graphics Corp. Previously he was vice- president of Landmark's drilling systems. Bill joined Halliburton Energy Services in 1984 as a field engineer, where he was responsible for acquiring and processing open and cased-hole well log data. Until 1997 when he joined Landmark, he held various positions in Halliburton operations, software development, research, and management. Bill is a graduate of the Colorado School of Mines and holds a bachelor's degree in petroleum engineering.
Philip Longorio is currently vice-president of Sperry-Sun, Halliburton Energy Services. Since joining Halliburton in 1977, he has held various executive positions within business development and operations. He is presently responsible for general management activities in directional drilling, logging-while-drilling, measurement-while-drilling, and service data logging. As a member of Halliburton's executive management team, he serves on several foreign boards of directors where he represents Halliburton's financial interests. He is a member of API, SPWLA, and SPE.
