Study benchmarks 2001 drilling, completion costs for 400 South Texas gas wells
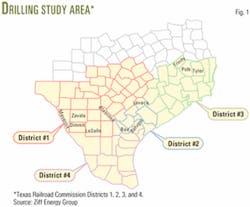
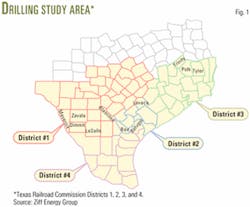
A group of operating companies with gas well completions in South Texas participated in a 400-well drilling costs and practices benchmarking study. The 12 companies, of all sizes from independents to majors, had drilled the wells in Texas Railroad Commission Districts 1, 2, 3, and 4 during 2001 (Fig. 1).
The study assessed more than $1 billion of capital spending, of which the operators had spent $685 million for drilling costs and $360 million for total completion costs.
Categorizing the wells into seven asset class groups, the study found that average-drilling costs for the groups varied widely from a low of $71/ft to more than $200/ ft.
Project design
South Texas is one of the most active US onshore gas exploration and production areas, and 2001 was a period of strong gas-drilling activity, says Houston-based Ziff Energy Group that conducted the study.
The company says the operators with active drilling operations in the area strongly supported the project's best-practices investigation by providing study design input for peer-well groupings, cost classifications, cost drivers, and drilling practices.
The operators agreed to peer groups based on factors related to type and difficulty of drilling, such as well depth, pressure conditions of the zones encountered, and whether the well is vertical or directional.
The study's key measures included drilling costs in $/ft, average drilling rate in ft/day, and the unit cost of initial production in $/Mcfd equivalent.
The study presented the findings in blinded or confidential well-level comparisons of the costs within the peer groups of similar wells.
The company says participating operators received a detailed diagnostic report on each well, comparing it on a like-kind basis with peer wells, which identified potential savings in each cost category.
Asset peer groups
The study grouped the wells into seven categories with increasing levels of drilling and completion severity or difficulty. Depth was a main subdivision with shallow wells defined as less than 10,000 ft and deep wells greater than 10,000 ft.
The study categorized shallow wells encountering zones that were either normal or over pressured, with normal pressure referring to zones with salt-water hydrostatic gradient to surface or less. Over pressured referred to zones with greater than salt-water gradient to surface.
The remaining five categories were for deep wells or wells deeper than 10,000 ft, as follows:
•Normal pressure or formation pore pressures exist at a salt-water gradient or less.
•Over pressure or formation pore pressures greater than salt-water gradient.
•Under and over pressure, with the well encountering pore pressures, both significantly less than salt water gradient and greater than salt water gradient.
•Directional, over pressure wells that encounter greater than salt-water gradient.
•Directional, under and over pressure, with the well encountering pore pressures significantly less than salt water gradient and greater than salt-water gradient.
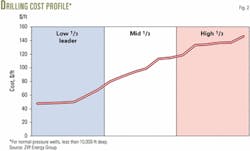
Fig. 2 shows the drilling cost profile for the shallow normal pressure well group, with average group drilling costs of $95/ft and a best-in-class well costing $53/ft on average.
The company says rig and tubular costs accounted for almost half of the shallow normal-pressure well costs. Completion costs for the well group varied significantly, with an average cost of about $365/Mcfd equivalent.
Benchmarking
In addition to the peer-group comparisons, the study provided comparisons more specific to the needs of individual participants, benchmarking for example on:
- Hole or casing size.
- By target formation.
- By size of the drilling program.
Data were collected for trouble incidents, geographic objective, well depth, whether the wells were located in environmentally sensitive areas, and detailed drilling time break down provided drilling cost data for cost-driver analysis.
From information supplied through questionnaires and personal wellsite visits, the operators highlighted three leading drilling practice areas that drive lower drilling costs. Three practice areas that were of particular interest are as follows:
- Drilling procedures to avoid difficulties.
- Directional drilling planning and execution.
- Practices to maximize drilling rate of penetration.
Based on discussions at the design advisory meeting regarding theme topics, avoiding and quantifying trouble time, operators highlighted key practices that include:
- Contracting practices.
- Mud and chemicals.
- Compensation issues or incentive bonuses.
- Training.
- Organizational learning.
- Inspections of the drillstrings and blowout preventer.


