Membrane technology removes CO2 from liquid ethane
A 2,000-b/d pilot facility using a full-size membrane element to remove CO2 from liquid ethane started up on August 2000 at the BP Empress ethane and NGL extraction facility, Medicine Hat, Alta. The pilot plant constructed by NATCO-Cynara has successfully operated for more than 1 year.
Membranes are widely used to remove CO2 from natural gas. Using membranes to remove CO2 from NGL is relatively new. The BP facility demonstrated that cellulose acetate hollow fiber membranes are effective in removing CO2 from liquid ethane.
In addition, the facility:
- Demonstrated insignificant ethane losses to permeate.
- Provided an unexpected benefit of removing some methane from the ethane.
- Proved that membrane longevity is not an issue in this application.
Background
The BP Empress complex is one of the largest natural gas processing and extraction facilities in North America. A turboexpander process liquefies and separates ethane and NGL from a methane stream.
The ethane product contains CO2 from the separation process. CO2 is highly soluble in NGL and, due to ethane product-specification requirements, some of the CO2 must be removed before further processing and sale.
Several existing technologies effectively remove CO2 from ethane and natural gas. These include solvent technologies, such as an amine system, or an altered process design to reject or recover CO2.
These options, however, can have high capital costs or operational difficulties. Because membranes do not have these disadvantages, BP wanted to determine the viability of membrane technology for removing CO2 from ethane.
Plant description
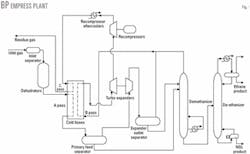
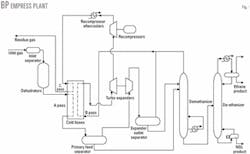
The BP Empress plants are at the Alberta-Saskatchewan border about 350 km east of Calgary. A single-stage turboexpander process recovers ethane and NGL. Fig. 1 shows a simplified plant schematic.
Main-line gas transmission systems of TransCanada PipeLines Ltd. and Foothills Pipe Lines Ltd. feed natural gas to the Empress plants. Molecular-sieve dehydrators remove virtually all water.
Brazed aluminum heat exchangers chill the gas, which is further cooled in turboexpanders. Separators recover ethane and NGL, which are then fractionated in demethanizer and de-ethanizer columns.
Design ethane recoveries vary from 42% to 70%. Stripped residue gas returns to the gas transmission pipelines at the same pressure and temperature. The plants are called "straddle" plants because they straddle main gas transmission lines.
Nature of the problem
Ethane and CO2 have similar boiling points and relative volatilities, which results in a considerable amount of CO2 recovered and produced in conjunction with ethane.
The amount of CO2 in ethane is primarily a function of:
- CO2 content in the inlet gas. If this increases, more CO2 is produced in the ethane product for a fixed ethane-recovery level.
- Level of ethane recovery. As this increases, CO2 in the ethane rises for a fixed CO2 content in the inlet gas.
The plant specification is a maximum of 6.0 mole % CO2 in the ethane product. Present plant design and process conditions can meet this specification if the inlet gas has a low concentration of CO2 ±0.7 mole %.
This specification resulted in an ethane production constraint outside the facilities' capabilities. Reducing ethane CO2 content would allow considerably higher ethane production, which would provide greater economic and marketing opportunities to BP.
Process options
BP considered several options to reduce CO2 in the ethane product, including:
- Solvent technology, e.g., amine system.
- A modified plant process to reject more CO2 to the residue gas and allow less coproduction with the ethane.
- Membrane technology.
Membrane technology had several potential advantages, including:
- Lower capital costs vs. competing technologies.
- Relatively simple process control and operation.
- Low maintenance requirements.
- Relatively low operating costs.
- A modular design makes it relatively easy to scale up or down due to changes in process conditions and specifications.
Membrane technology in this application has some limitations:
- Plant ethane recovery cannot extend beyond original design rates. Some newer gas processing designs provide lower ethane CO2 content while increasing ethane recovery.
- Membranes can only remove a certain amount of CO2. Solvent technologies can remove almost all the CO2, which is required for some ethane product specifications and markets.
Membrane technology had significant potential benefits in this application. Commercial applications of treating liquid ethane to remove CO2 are limited; there is only one similar commercial application of this technology, which demonstrated that the technology is feasible.1 2
The application, however, operated for a relatively short time due to a change in plant operating conditions and requirements. There were no applications on stream longer than 1 year to prove the longevity of membrane performance in this application.
The BP Empress facility had to treat at least 3,500 cu m/day (22,000 b/d), and potentially significantly more. BP, therefore, installed a pilot plant to evaluate the technology.
Pilot plant
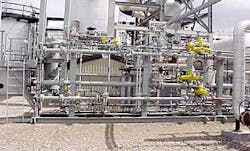
The pilot unit (Fig. 2) contains one full-size membrane, associated inlet filters, process isolation valves, and a programmable logic controller (PLC).
A full-size membrane facility would simply be a series of pilot facilities manifolded together, which makes it easy to scale up the facility to process a wide variety of flow rates and CO2 removal amounts.
Each stream had a flow, pressure, and temperature measurement, which fed into the PLC mounted on the skid. The PLC interfaced with the Empress plant control system via a serial link. All data from the skid were available to operators on the main control system.
The plant information system also contained data points that interfaced to the plant control system. The plant information system is a data server with PC-client applications, such as spreadsheet add ins, and trending and graphics software.
This provides detailed monitoring, analysis, and historical information for engineering staff.
An automated macro created a daily spreadsheet report, which was e-mailed to plant and Natco-Cynara Membrane Separations Systems staff.
BP used a PLC for control and sequencing functions, including all start-up, operating, and shutdown functions (start-up permissives, sequencing, timing, equipment safeguarding, and control).
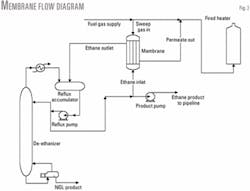
Fig. 3 shows a simplified schematic of how the membrane skid was tied into the plant.
The ethane product pump supplied feed to the membrane. Ethane product from the membrane was sent back to the reflux accumulator. A slipstream from the fuel gas supply header provided sweep gas.
Permeate gas from the membrane combined with fuel gas and fired a process fired heater, since the pilot facility had small enough process volumes to permit this. A full-scale facility requires recompression and reinjection of permeate gas to residue.
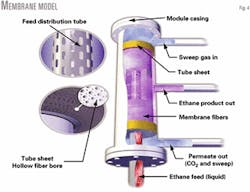
Fig. 4 shows a schematic of the membrane. An ideal shell-side flow pattern is radial cross flow with fuel gas sweep from top to bottom.
Membrane performance
Pilot plant performance objectives aimed to answer the questions:
- What is CO2 removal performance?
- What is membrane capacity?
- Removal performance is a function of, or sensitive to, what variables?
- How much ethane is lost to the permeate stream?
- What is the degree of methane transport? Will methane from the sweep gas cross over and contaminate the ethane product stream?
- What is the lifetime of the membrane? What is the performance degradation over time and what are the causes?
CO2-removal performance
Process CO2-removal performance is a primarily a function of ethane feed rate and sweep gas feed rate. CO2 in the ethane was not constant but varied with the plant process conditions, which included CO2 in the inlet gas and the level of ethane recovery.
Feed ethane pressure and temperature were constant for the testing period, at about 3,180 kPa and 0-3° C., respectively. The operator could vary the sweep-gas pressure to a small degree by manually throttling a valve on the permeate stream. Sweep-gas pressure was constant for the testing period.
Sweep-gas pressure is typically 345 kPa, which results in a permeate pressure of 205 kPa. Sweep-gas temperature varied from 0° C. to 15° C.
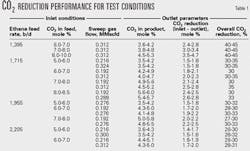
Table 1, summarizing the test data, shows membrane performance as a function of the two primary control variables: ethane feed and sweep gas feed.
Less CO2 separates from ethane at higher feed rates. The data show that increasing sweep flow results in increased CO2 removal.
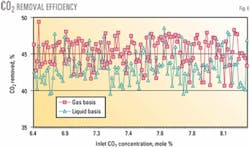
Table 1 also shows that the percentage of CO2 removed is almost constant with variable feed CO2 concentrations. At higher concentrations, therefore, the percentage point drop of the ethane product vs. the feed becomes progressively larger due to a larger driving force for separation.
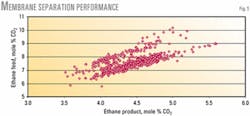
Figs. 5 and 6 illustrate this performance. Ethane feed rate and sweep flow are constant at 1,396 b/d and 0.312 MMscfd, respectively.
Ethane losses
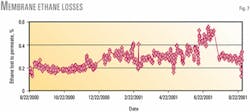
Ethane losses were less than 0.5% during the test. Fig. 7 shows the percentage of ethane lost from the feed stream to the permeate stream. Ethane losses are slightly higher (0.1-0.2%) at lower ethane feed rates and higher sweep-gas flows because there is more time for the transport to occur.
The step change in ethane loss (July 22, 2001; Fig. 7) corresponded to replacement of the membrane element. Ethane losses to the permeate stream appear to increase gradually; but when changes in feed rate and sweep rate are taken into account, this increase is not statistically significant.
Methane transport
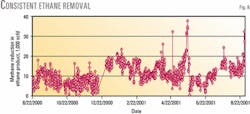
The pilot study measured methane transport across the membrane. BP was concerned that methane from the sweep stream (95%+ methane at 410 kPa) would contaminate the liquid ethane stream (<2% methane at 3,200 kPa). Study results consistently showed that the membrane removed methane from the feed stream.
Fig. 8 shows that the volume of methane removed stays within a consistent range. This results in an ethane product that is lower in methane. For a typical methane concentration (1.5-2.5 mole % in the ethane feed), methane is reduced by 10-30% in the ethane product.
Methane transport from the liquid ethane to the sweep is not surprising. Deriving the driving force for transport based on the mole fraction of dissolved methane in liquid ethane and the partial pressure of methane in the sweep stream is inconsistent. Chemical potential or fugacity is more accurate when one derives the driving force.
Wijmans and Baker propose an alternate method to provide a consistent estimate of the driving force.3 The method is based on the fact that a liquid and its vapor have the same chemical potential at equilibrium and constant temperature and pressure.
A flash calculation of the liquid ethane stream should provide an estimate of the vapor phase composition that is in equilibrium with the liquid. Comparing this vapor-phase partial pressure to sweep-stream partial pressure should provide a reasonable estimate of the transport driving force. This method predicts that methane will be transported from the liquid feed to the sweep stream.
Membrane longevity
The study also determined membrane lifetime. Membrane replacement rates play an important role in process economics; however, no lifetime data exist for this application.
Membrane performance typically declines with time. One mechanism is compaction, characterized by a gradual decline in capacity, which is typically linear vs. logarithm of time. Compaction generally increases with higher pressure, temperature, or feed CO2 content.
Feed contaminants can also adversely affect membrane life. High aromatics, amines, glycol, or water levels can rapidly and irreversibly degrade membrane performance.
This application is well suited to membranes because the CO2 concentrations, absolute pressure, and temperature are low. Contaminants in the stream are negligible. There was no measurable decrease in membrane performance over the testing period (less than 1 year). Based on this testing, we estimate that membrane performance will decrease 5%/year.
Separation, operational performance
The membrane can satisfactorily separate CO2 from ethane. The ethane- CO2 separation was slightly below initial calculations and expectations.
Ethane losses were lower than initially calculated and expected. Ethane losses did not change or increase enough during the testing period to indicate a membrane life expectancy.
The membrane's ability to maintain separation performance for a significant time period increases the viability for this application. If the membrane elements require frequent replacement (every year), economic viability would be severely impacted.
Methane transport from ethane to the sweep gas was opposite of what was initially expected. The operational benefit allowed operation at, or exceeding, the methane-in-ethane specification on the demethanizer. This allowed a lower demethanizer reboiler duty and lower ethane losses in the demethanizer.
If the methane contaminated the ethane, BP would have had to run the demethanizer at an excessively low methane-in-ethane specification. This would raise operating costs and lower ethane recovery. The unexpected methane transport also led to a better prediction of membrane performance.
The membrane skid is advantageous from an operations and maintenance standpoint. It requires minimal attention from operations staff. Start-ups, operations, and shutdowns are completely automated with the standalone, skid-mounted PLC. The unit requires little maintenance. Membrane and filter element removal is simple and straightforward.
The PLC and logic controllers performed well. The membranes must be started up and shut down in a "rigorous" fashion. If certain parameters (e.g., depressurization) are not controlled and sequenced properly, irreparable damage can occur to the membrane element.
This was a concern in the early design phase; however, there were no problems with the system. The unit was shut down and started up many times during the testing period with no apparent detriment to membrane performance.
Our most significant challenge during the testing period was to ensure properly functioning instrumentation. Obtaining and maintaining accurate measurement of the ethane product stream was the most difficult element. This stream is often close to, or at, its bubble point. Any flashing will cause inaccurate flow measurement and component analysis.
Overall mass balance was good, and usually varied less than 1%. The component material balance was more erroneous, especially on components with small concentrations. The mass and component balance could be calculated on a total inlet and total outlet basis, as well as a liquid and gas basis.
For example, one can determine the amount of CO2 removed from the ethane by measuring:
- The liquid ethane inlet and outlet flows and component analysis and directly calculating the amount of CO2 removed. This is a liquid-basis calculation.
- The sweep gas and permeate-gas flows and component analysis and calculating the amount of CO2 added to the permeate. This is a gas-basis calculation.
CO2 added to the sweep gas should equal CO2 removed from the ethane, but these did not always balance. When there was a discrepancy with the mass balance or component mass balance, we used data from the sweep gas. Gas measurement, and especially gas component analysis, is more reliable.
The ethane feed stream was less error prone because custody-transfer sampling equipment and chromatographs analyze the stream. A process chromatograph, which is more error prone, measured the ethane product stream.
Acknowledgment
We gratefully acknowledge the assistance of Doug Bird and Dennis Thorburn, BP Canada Energy Resources, Dwight Forga and Bob Hamaker, NATCO-Cynara Membrane Separation Systems, Emilio Quiroga, TEST Automation and Controls, and John Housch, Shell Canada Ltd., for their assistance during this project.
References
- Wayculis, J.J., US Patent 5149340, 1992.
- Thornton, D.H., "Membrane process for CO2 removal from NGLs gets trial in Louisiana plant," OGJ, Nov. 14, 1994, pp. 86-90.
- Wijmans, J.G., and Baker, R.W., "A simple predictive treatment of the permeation process in pervaporation," Journal of Membrane Science, Vol. 79 (1993), pp. 101-113.
Based on a presentation to 82nd Annual GPA Convention, Dallas, Mar. 11-13, 2002.
The authors
Grant Gall is a facilities engineer at BP Canada Energy Co.'s Empress Gas Plant, Medicine Hat, Alta., Canada. He previously worked in the NGL central engineering group and the drilling and completions department for Amoco Canada Petroleum Co. Ltd., Calgary. Gall received a BSc in mechanical engineering (1988) from the University of Saskatchewan. He is a professional engineer in Alberta and a member of APEGGA.
Edgar S. Sanders is the technology director for NATCO-Cynara Membrane Systems, Houston. Prior to joining Cynara in 1997, he spent 14 years with the Dow Chemical Co., Walnut Creek, Calif., where he managed the central research gas separations group. Sanders holds a BS (1979) and a PhD in chemical engineering (1983) from North Carolina State University. He is a member of the NAMS, GPA, and Sigma Xi.
Membrane technology
A membrane is a barrier that separates two phases and selectively restricts the transport of different components. A membrane system separates an influent stream into two effluent streams known as permeate and concentrate. The concentrate stream is also called the product or nonpermeate stream. In this case, concentrate is treated ethane product.
For components or "penetrants" to traverse the membrane, a chemical potential gradient must exist. For gases, the difference in partial pressure between the feed (high) and permeate (low) often approximates the chemical potential gradient. For liquids, the concentration difference between the feed and permeate most often approximates the chemical potential gradient.
There are different membrane separation processes. The membrane separation process in the BP pilot plant is most closely related to pervaporation, which is the transport of components from a liquid feed through a membrane into a gas phase.
Ethane transport is clearly pervaporation. Liquid ethane is fed to the membrane and gaseous ethane leaves in the permeate. CO2 and methane are dissolved components in the liquid ethane. The physical properties of the dissolved molecules are not identical to the liquid or gas.
Whether the components are gas or liquid, transport (permeation) through a membrane consists of three consecutive steps:
- Component absorption and adsorption from the liquid feed into the membrane material.
- Diffusion of the dissolved component down the chemical potential gradient through the membrane matrix.
- Component desorption from the membrane into the permeate stream.
This is called the solution-diffusion model.
The permeation rate for a solution-diffusion membrane is the product of the solubility term and mobility (diffusivity) term. Solubility is related to the amount of component or penetrant that is in the membrane. Mobility is related to how fast the component or penetrant moves through the membrane matrix.
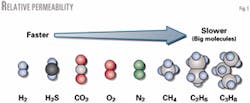
Fig. 9 shows the relative transport and permeability of molecules in a typical natural gas stream.
For ideal systems, the solubility-related term is a constant-solubility coefficient and the mobility-related term is a constant-diffusion coefficient. Permeability, which is a constant, is the product of the two coefficients.
For a first approximation, component condensability determines the solubility coefficient. Simple physical measures of condensability, such as normal boiling point, critical temperature, or Lennard-Jones potential well depth, correlate with the solubility coefficient.
More condensable components have higher solubility coefficients than less-condensable components. For solution-diffusion membranes, diffusion occurs when the penetrant jumps from one molecular-scale berth within the dense polymer matrix to another.
Larger molecules require higher activation energy for the diffusional jump, and are less likely to jump. Diffusivity correlates with the penetrant's molecular size. Larger molecules have lower diffusion coefficients than small molecules.
Membranes in gas separation
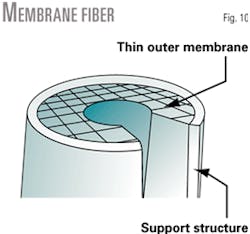
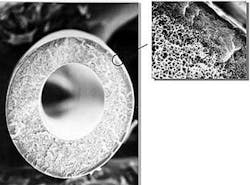
The heart of the membrane module is an asymmetric hollow fiber (Fig. 10), manufactured from a cellulose-acetate polymer. Fiber geometry is similar to a long, thin straw, and is about three times the diameter of a human hair.
While the hollow fiber is a homogeneous polymer, the density gradient of the polymer across the wall of the fiber is asymmetric (Fig. 11). The fiber's "structure" changes considerably from the outside to the inside wall. The fiber has two main "structural" components:
- The outside wall is a dense polymer and is only 0.05-0.10 μm thick. The actual separation occurs at this thin layer. The fiber's permeance, or productivity, is inversely proportional to the thickness of the dense outer layer.
- The porous sublayer serves as the membrane support structure. The sublayer makes up a majority of the fiber diameter. The porous sublayer determines the fiber's ability to withstand large pressure differentials.
Membrane manufacture
Membrane geometry, dimensions, and structure are carefully controlled in the manufacturing (spinning) operation.
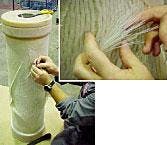
Fig. 12 shows the incorporation of an asymmetric hollow-fiber membrane into a typical membrane module. Thousands of fibers grouped together in a cylindrical arrangement around a central core tube form the membrane module.
An epoxy resin ring seals each end of the cylindrical fiber element. This "tubesheet" provides a seal between the fibers' outside wall (feed) and bore (permeate). This arrangement is analogous to a shell-and-tube heat exchanger.
CO2 removal
For the pilot plant module, pressurized gas or liquid feed is placed on the fiber's outside portion. The bore has a lower pressure. The difference in partial pressure between the exterior feed stream and interior permeate gas drives components across the membrane wall.
Because CO2 has the highest permeability, it selectively separates from the feed stream. The permeate travels down the fiber's length where it collects and separates from the feed stream. The ethane left behind forms the ethane product stream.
Due to the large ratio between fiber length and inside diameter, accumulated CO2 in the bore creates backpressure. The backpressure decreases the partial pressure difference across the fiber, which reduces the driving force for separation and limits CO2 removal.
Separation can be enhanced if conditions across the membrane improve the difference in partial pressures. One method is to place the permeate section of the membrane under vacuum.
Another way is to flow a "sweep gas" through the permeate section of the membrane.2 Sweep gas should have a low partial pressure of CO2. In this case, BP used plant residue gas consisting primarily of methane. This assists the driving force by transporting and carrying permeate through the fiber. It helps maintain a lower partial pressure of CO2 in permeate by diluting and purging the stream.
The permeate pressure usually increases with sweep gas, but the partial pressure of CO2 actually decreases. This has the net effect of increasing the driving force across the membrane.
