Fracing controls sand in screenless Saudi high-rate gas wells
Hydraulic fracturing with screenless completions resulted in clean flow from wells completed in the high sanding tendency Jauf gas reservoir in Saudi Arabia. Saudi Aramco has repeatedly cycled these wells and they have remained solids free.
These screenless completion methods offer significant benefits over traditional frac packs in wells with unconsolidated rock that require longer half-length fractures for optimum well deliverability.
Saudi Aramco is currently undertaking one of the largest gas development projects in the world that consists of many new deep wells, four world-class gas plants, and massive development of new infrastructure.
The Jauf reservoir, one of several in the gas development project, is a sandstone with unique characteristics that exhibits low-to-moderate permeability but a high sanding tendency caused by unconsolidated rock under high pressure and temperature.
Saudi Aramco initially considered frac-packing all the wells for sand-control purposes, but the relatively low permeability encountered in tests of the first Jauf reservoir producers clearly indicated that the wells would require highly conductive, long half-length hydraulic fractures to meet gas rate targets.
Hence, it decided to pursue fracturing for sand control techniques with screenless completions that have resulted in wells producing 10-50 MMscfd solids-free gas with high condensate yields. Traditional frac packs will be performed only in selective cases based on economic and strategic considerations.
Gas project
Saudi Aramco embarked on an aggressive nonassociated gas development program and expansion project in 1995. This project encompasses drilling new wells, developing known reserves in Ghawar and new fields, constructing new facilities, and upgrading and expanding existing facilities.
It recently commissioned the 1.6-bcfd Hawiyah gas treatment plant and plans to complete the 1.6-bcfd Harad gas plant in mid-2003.
The majority of wells drilled to feed the Hawiyah gas plant exhibited reservoir characteristics that indicated that well stimulation would be required to meet production targets. Furthermore, core and openhole test data from the first wells drilled provided proof of a highly unconsolidated reservoir rock.
The first stimulation treatment, pumped in early 1999 in a well completed with 51/2-in. tubing in a 7-in. liner, was in a good quality reservoir with a low Young's modulus in several layers.
The first stage of a two-stage fracturing job was in a 60-ft interval with 60° phased perforations, and the second stage was in a 20-ft interval. The job included pumping a large pad and 20-40 intermediate-strength proppant (ISP) at a maximum concentration of 8 lb proppant added to 1 gal of fluid (ppa). No tip screenout was desired and the job used no flowback control.
The treatment was ineffective in controlling solids flowback because the 55-day flowback recovered a large mass, not measured, of predominantly formation sand. The well achieved a clean rate only when it was choked back.
A second mid-2000 stimulation treatment, in a well with 41/2-in. tubing and a 7-in. liner, was in an average quality reservoir that had some high-porosity unconsolidated layers throughout. The well flowed at a 12 MMscfd prestimulation rate after perforation of all 300 ft of net sand with 60° phased guns.
The treatment consisted of reperforating 80 ft of net sand to obtain adequate perforation hole size for fracturing. The job tested, for the first time in Saudi Arabia, a liquid proppant flowback control in the form of a tacky polymer mixed with a blend of carrier solvent package.
Job results were disappointing because the well flowed back for 40 days at a final rate equal to the prestimulation rate. It failed to achieve a clean flow rate. Recovered were 5,300 kg of total solids at the end of the flowback period.
Following these early disappointments, it became apparent that the approach needed step changes.
Saudi Aramco expected all stimulation candidates already drilled or being drilled to have similar or worse sanding tendency than the first two treated wells. Because it needed Jauf reservoir wells to feed the new gas plant scheduled for commissioning in about 1 year, Saudi Aramco management took prompt action to find solutions to the problem and formed a team of Saudi Aramco and Schlumberger Ltd. technical experts to optimize stimulation treatments while trying to meet production targets.
Reservoir geology
The Jauf formation is early Devonian sandstone. It is a deep sequence of thin sandstone and shale sequences with much variation in permeability and porosity.
Wells encounter high permeability and porosity layers that are excellent flow conduits. These conduits, however, have generally a lower modulus sand that increases the risk and commonly results in formation sand production.
The Jauf includes fine to medium-grained sandstone that consist primarily of quartz, but also contains feldspars and clay minerals, including illite, chlorite, and illite-montmorillonite mixed layer clays. This complex mineralogy suggests that the formation may be sensitive to aqueous fluids.
Formation compatibility tests determined that completions require a 7% KCl fluid to prevent clay migration.
The Unayzah formation, which at times has low permeable quartz cemented sandstone, or the Khuff formation, which is a carbonate, are above the Jauf reservoirs. Hard dense limestone usually forms the lower Khuff.
Both formations provide containment and keep Jauf proppant fractures from propagating upwards.
A 3D seismic survey reveals that the reservoir has many faults, especially in the southwestern part. These faults and reservoir fluid variations indicate a compartmentalized reservoir. The reservoir pinches out toward the west, and major faults bound it on the east and west.
The deep Jauf reservoir had a 8,750-psi initial pressure, and its temperature is 300° F.
Rock mechanics
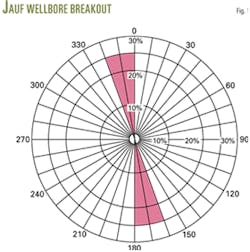
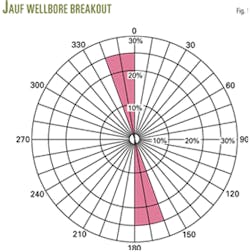
The reservoir has a 260° maximum fracture orientation east to west. This orientation has been confirmed by borehole breakout and fullbore formation microimager (FMI) logs. Fig. 1 is a typical rosette diagram of Jauf wellbore breakout.
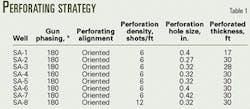
Current perforation strategy orients the perforations into the maximum stress using 180° phasing and six shots/ft. This strategy provides solid control and reduces near-wellbore friction pressures.
The Juaf has an average 5-6 million psi Young's modulus and a corresponding 0.29 Poisons ratio in the competent sand. In unconsolidated zones, Young's modulus typical averages 1-2 million psi.
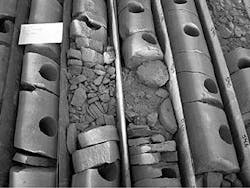
Fig. 2 shows a typical core with unconsolidated sand intervals.
Current strategy is not to perforate unconsolidated intervals. If possible, these intervals will be left with a 10-20 ft standoff, and the strategy limits perforations to a minimum 30-40 ft.
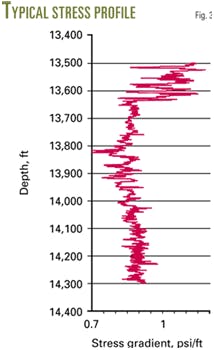
The jobs use stress logs for determining perforation strategy, sanding tendency, and fracture geometry. Correlated with static and dynamic properties obtained from core analysis, microfrac testing, and data-frac analysis, the stress log (Fig. 3) clearly indicates the stress contrast between the consolidated and unconsolidated rock.
Core and log analyses of the laminated shales within the Jauf, originally believed to be barriers, indicate that these intervals are dirty sandstones that usually consist of fine quartz cemented sandstone. Temperature surveys and radioactive tracer analyses indicate that the shales are not true barriers.
Geochemical analysis of the core has further refined the stress log for identifying shale from dense sandstone stringers.
Stimulation optimization
The optimization team selected 10 wells with varying reservoir and sanding tendency characteristics. The accompanying box shows the optimization workflow.
Eight of the 10 selected wells have been stimulated by yearend 2001.
Saudi Aramco developed its guidelines for well flowback after a frac from best industry practices, minimum solids handling capacity, desire to mitigate erosional corrosion effects in pipelines, and lessons learned in the ongoing fracturing campaign.
The jobs include a high-pressure coiled tubing cleanout as soon as the tree saver has been removed. This cleanout puts the well on production as soon as practical to ensure that all solids recovered during the flowback period come from the formation, not the wellbore. This allows for the proper assessment of the success or failure of the sand control strategy.
The jobs flowback all wells through a sand management system (SMS) that includes a hydrocyclone desander, filter screens, a testing choke manifold, a test separator, and facilities to recover and measure solids.
The system removes solids from the surface flowstream before taking the pressure drop at the choke manifold. It has proven, however, ineffective during the early clean-up flow period because the hydrocyclone cannot remove solids from the viscous gel that is loaded with proppant and plugs the filter screens.
As a backup to the SMS and to shorten cleanout time, the jobs include an expendable choke manifold system with multiple positive chokes to ensure the well can flow continuously.
Initially all wells flow back through the expendable choke system. Once the flowback fluid viscosity decreases to a level that can be handled by the SMS, the flow is switched and the well flows very slowly on an initial 14/64-in. choke.
If no slugging occurs, the choke is increased in 2/64-in. increments. The process maintains the choke opening constant until the rate of solids drops to 1 kg/hr during a continuous 4-hr flow period. A given choke setting is kept constant for a minimum of 8 hr. If the well is shut-in for any reason, the choke increase procedure starts over at a 14/64-in. setting.
The procedure flushes the desander every 2 hr if a large volume of solids flows back, or less frequently if the volume is small. This flushing continues until the well flow is clean.
The current definition of a clean rate is when a well has only 0.3 lb of solids/ MMscfd. After producing at this rate, the well is cycled a couple of times to verify the sand-free rate before handing the well over for production.
Fracturing results
Seven out of the eight wells fractured to date under optimized screenless completion guidelines have achieved clean rates, in most cases at maximum potential. The eighth well had mechanical problems, leading to inconclusive post-frac test results.
All wells delivering gas to the Hawiyah gas plant have been cycled several times in the last 6 months and are flowing solids free.
Table 1 shows the perforating strategies for all wells treated to date and Table 2 details the treatments.
Well SA-1
Well SA-1 was Saudi Aramco's first well in which the stimulation included oriented perforating and a limited perforated interval, two key screenless completion techniques now routinely implemented in all hydraulically fractured wells.
The well completed with 51/2-in. by 41/2-in. tubing in a 7-in. liner had perforations (six shots/ft) at 13,800 ft.
Core data showed good reservoir qualities, relatively low-stress gradient, average 2.5 million psi Young's modulus in the net sand, and highly unconsolidated sand layers that indicated a high sanding tendency.
In this and all successive wells, the jobs included FMI logs, when available, that determined the direction of minimum stress for aligning perforations with the preferred fracture plane.
In SA-1, the job involved perforating a 17-ft interval with slightly higher than average Young's modulus with 180° phasing because a continuous zone with high compressive strength could not be found.
The well, after perforating, flowed back at a 2-MMscfd average rate with 3,800-psi wellhead pressure.
Before the main frac, a step-rate test with radioactive tracer tagged fluid and downhole pressure gauges ascertained the effectiveness of oriented perforating in reducing the high near-wellbore losses observed in the two wells fractured prior to the current sand-control strategy.
The test estimated an average 300-psi tortuosity at 40 bbl/min, which was a significant improvement from the 900-psi average recorded from earlier Jauf frac treatments.
Next a fluid calibration test with a different radioactive tracer and a temperature-spectra-gamma-ray log attempted to determine leakoff data and fracture height. Tool failure, however, yielded inconclusive results.
The main frac, 3 days later, displaced the treatment fluid entirely into the formation without complications. The tacky liquid proppant flowback control, unsuccessful in an earlier well, was tried again with some modifications but with equally disappointing results.
The forced closure procedure in the job included opening the well after reaching closure pressure and flowing back 150 bbl of fluid at 2 bbl/min. The job did not include a coiled-tubing cleanout because the SMS was expected to handle the flowback.
The SMS unfortunately experienced continuous plugging caused by an unanticipated large volume of solids and frac fluid flowing back. It had to be shut down and flushed continuously, thus considerably lengthening the cleanup period.
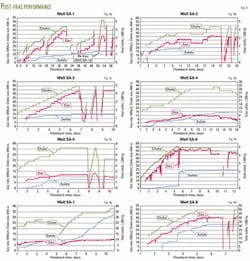
The well exhibiting a robust post-frac rate performance during the initial 17-day flowback period (Fig. 4a). The solids (proppant and formation sand), however, showed no indication of decreasing.
An SMS mechanical failure forced a 2-week closure of the well.
The constant solids flowback rate continued upon flow resumption, with the aggravating factor that more than 50% of produced solids was formation sand. A high-pressure coiled-tubing clean out the well to TD after a wireline tag had confirmed fill at the base of the perforations.
The next problem was that a gamma-ray logging tool for evaluating tracer performance became stuck and heavy mud had to be used to kill the well after many unsuccessful attempts to retrieve the tool.
The 22-MMscfd flow rate after displacing the mud indicated that the mud had damaged the well. Before being killed, the well flowed 32 MMscfd at the same 5,200-psi wellhead pressure.
The solids flowback increased significantly, almost exclusively formation sand. After a long and complicated cleanup period, and unsuccessful attempts to control solids flowback, Saudi Aramco decided to suspend the well.
Total recovered solids at suspension time was 13,800 kg. The maximum pressure drawdown applied to SA-1 was about 2,000 psi and it did not achieve a solids-free production.
Well SA-2
Well SA-2 was the first well to use Saudi Aramco-Schlumberger technical team's screenless guidelines and technologies aimed at controlling proppant flowback and stopping sand production. The job, in addition to oriented perforating in a limited interval, included for the first time a significant pad reduction to achieve a tip screenout and a high-temperature fiber flowback control material combined with intermediate strength proppant (ISP).
Furthermore, an expendable choke system backed up the SMS.
A petrophysical model based on offset well data improved the mechanical properties models and stress profile. The job also used a new sanding model.
The well, completed with 51/2-in. by 41/2-in. tubing in 7-in. liner, had perforations (six shots/ft) at 14,000 ft. Its reservoir quality was good. The reservoir has an average 3 million psi Young's modulus but layers with a lower modulus and high sanding tendencies are found throughout the net sand.
The job placed perforations in a stable 30-ft interval below the main target zone. The well, after perforating, flowed at a 1.6 MMscfd maximum rate with a 550-psi wellhead pressure.
Step rate and calibration tests estimated an average total near-wellbore pressure losses of 450 psi. A temperature tracer survey, within 2 hr after pumping, provided inconclusive results because the cool down apparently occurred in less than half of the predicted frac vertical growth.
The main frac treatment pumped all proppant with a tip screenout. This job differed from that in the previous well in that it forced closure with an additional 20 bbl.
Coiled tubing cleaned out the well, and it flowed without problems through the expendable choke system (Fig. 4b)
The solids rate slowed down considerably after recovering about 1,500 kg of solids during the first 24 hr of flow. The well flowed continuously because it was switched back and forth from the SMS to the expendable choke system.
The clean rate, after about 3 weeks, was a significant improvement from the previous well. Also the clean rate may have started earlier. The solids are measured at wet conditions, and considering that only 20 kg were recovered during the last 10 days of the flowback period, the dry solids mass recovered in all likelihood met the established clean-rate criterion.
The guidelines restricted flow to a 37-MMscfd maximum with 4,800-psi wellhead pressure because of the risk for destabilizing the flowback control fibers.
The procedure cycled the well twice to verify the clean rate. No additional solids were recovered with a maximum 1,500-psi pressure drawdown.
The flowback recovered 2,020 kg of total solids (proppant and formation sand).
Well SA-3
The job in Well SA-3 included further optimization procedures for screenless completions, such as:
- Refined petrophysical model based on core and other available data for seven offset wells.
- Mechanical properties model enhanced by regressing post-frac matched data collected during previous treatments.
- More robust sanding tendency model for optimum selection of perforated intervals.
- Perforating modeling to predict entrance hole diameter ranges and optimize proppant size selection.
- Combination, for the first time, of ISP, resin-coated proppant (RCP), and high-temperature fiber flowback control material.
- Radioactive tracers pumped with the main frac treatment.
- Aggressive tip-screenout design aimed for 3,000 psi of net pressure.
SA-3, completed with 51/2 by 41/2-in. tubing in a 7-in. liner, has perforations at 13,900 ft. Reservoir quality is among the best in that sector of the field. The reservoir has an average 3 million psi Young's modulus, but several layers have a modulus as low as 1.5 million psi.
The sanding tendency model predicted medium to high sanding potential in most of the fracture target zone. Hence, fracture geometry optimization determined the perforation depth because no zone appeared to be stable.
Calculations indicated that post-frac performance would be robust because flow from the openhole test was 27 MMscfd. The tests did not include a cased-hole flow test before the fracture treatment.
Step rate and calibration tests estimated an average total near-wellbore loss of 470 psi at 40 bbl/min, slightly dominated by tortuosity. A temperature tracer survey, shortly after the data frac, showed minimum fracture cool down of about 130 ft, roughly half of the main frac design. Calculated leakoff and data-frac analysis provided data for modifying the original design.
The main frac treatment proceeded according to design. A tip screenout began to occur as the 8-ppa ISP stage entered the perforations and about 650 psi net pressure. By the time of 10-ppa RCP stage, net pressure had built up to 1,750 psi. and continued gradually to increase to 2,750 psi. at the start of the 12-ppa stage.
At this point, net pressure increased rapidly to about 4,200 psi, and a near-wellbore screenout occurred. About 65,000 lb of the treatment remained in the tubulars.
The job forced closure with 20 bbl, and coiled tubing cleaned out the well. Tool malfunction of a radioactive tracer survey prevented these data from being interpretable.
The well initially flowed through the expendable choke system before being switched to the SMS.
The well achieved a clean rate almost immediately (Fig. 4c), although the total flowback period lasted about 10 days as per flowback guidelines,.
SMS temperature limitations prevented the well from producing its maximum potential. Maximum pressure drawdown was about 1,500 psi.
Cycling the well twice verified the clean rate. The flowback recovered 1.6 kg of total solids.
The excellent performance of well confirmed the effectiveness of the screenless completion strategy.
Well SA-4
Sand control was the main reason Well SA-4 was hydraulically fractured.
This well has complex reservoir characteristics. The Young's modulus appears to be higher than in previously treated wells, possibly indicating a competent formation, but the well produced significant formation sand during pre-frac well testing. The tests achieved a clean rate only by limiting the well to low gas rates.
The reservoir has interspaced zones with low Young's modulus, as is common in Jauf reservoirs. Furthermore, significant stress contrast exists between the upper and lower sections of the target zone, so that treatments need to be pumped in two-stages to achieve full coverage.
Short flow tests of the well's perforated 175-ft net sand interval showed a highly transient behavior with rapid pressure and rate decline that potentially indicated a compartmentalized reservoir.
For the treatment, a workover sealed off the long perforated interval and inserted a 41/2-in. liner into the original 7-in. liner. Then a 30-ft zone was reperforated with oriented perforating guns in a zone exhibiting low sanding tendencies as indicated by the sanding tendency model.
Perforating through two casing strings reduced the entrance hole diameter.
The well had a difficult time flowing back with the gas rate too low to measure.
The data-frac interpretation indicated total near-wellbore losses about 300 psi higher than detected in previously stimulated wells. The higher pressure was attributed to the dual casing string.
The temperature survey, about 2 hr after the calibration test, showed fracture growth in a downward direction from the perforations. This indicated high-stress contrast between the upper and lower reservoir sections.
Concerns about reduced entrance hole diameter, high potential for premature screenout, and unavailability of small size RCP supported the decision for pumping a treatment only with small-sized ISP and high-temperature fiber flowback control material.
The job tried to balance a tip screenout for sand control and a long half-length to increase conductivity in a reservoir with predicted poor performance.
The main frac treatment was pumped without complications, but flush started early and about 100,000 lb of intended treatment was not pumped as a precautionary step when net pressure began to increase too rapidly.
The well first flowed through the expendable choke system to unload as much pumped liquid as possible. Then coiled-tubing cleaned out the well.
A data-frac test, ahead of the second frac stage, estimated near wellbore losses at almost 800 psi higher than in previously treated wells.
The second frac stage unfortunately had a premature screenout after slightly less than half of the treatment was pumped. A second coiled-tubing run cleaned out the well before it was put on production.
The clean rate started after a 14-day flowback period (Fig. 4d). The well was not cycled.
Well SA-1A
Well SA-1A was the first and only refractured well, to date. The refracturing intended to obtain sustainable solids-free production and effective proppant flowback control.
The aggressive job design aimed for realizing a shorter but significantly thicker refracture than the initial fracture required a tip screenout for success.
This job, for the first time in the program, included only a combination of RCP and high-temperature fiber flowback control material.
A 10% acetic acid slug ahead of the treatment pushed away the near-wellbore debris. The treatment was pumped without any problems and a near wellbore screenout occurred shortly before pumping all the flush.
Coiled tubing cleaned out the well. It flowed first through the expendable choke system before being put through the SMS.
The clean rate started after 3 days (Fig. 4a).
Cycling the well twice verified the clean rate.
The flowback recovered about 50 kg of total solids, a significant improvement over the first fracture treatment.
Well SA-5
Well SA-5 followed the optimized screenless completion guidelines derived from the experience in previous wells. SA-5 is in a sector of the field with lower reservoir quality, so that the treatment's main objective was to obtain a long half-length fracture for improving conductivity.
The model predicted a low sanding tendency; therefore, the 30-ft perforating interval was selected for fracture geometry optimization purposes rather than sanding concerns.
The well has 51/2 by 41/2-in. tubing in a 7-in. liner.
Step rate and calibration tests estimated an average total near wellbore loss of 600 psi at 44 bbl/min. A temperature tracer survey, shortly after the data frac, showed minimum fracture cool down of about 130 ft and maximum of 240 ft.
Calculated leakoff and data-frac analysis led to a modification of the original design.
The treatment experienced a premature screenout after about a third of the treatment had been pumped.
Detailed investigation from a pressure buildup test concluded that the most likely cause was accelerated leakoff caused by a combination of uncontrolled vertical growth and the presence of a natural fracture system, detected by the buildup test.
A clean rate was achieved after 6 days (Fig. 4e).
Cycling the well twice verified the clean rate. The flowback recovered 153 kg of total solids.
Well SA-6
The job in Well SA-6 included all optimized screenless completion guidelines.
The well, completed with 51/2-in. tubing in a 7-in. liner, has perforations at about 14,100 ft. Reservoir quality is good in the upper 200 ft, with an average 3 million psi Young's modulus. The reservoir has significant stress contrast between the upper and lower sections, so that the upper section was the only fracturing target in the job design.
The sanding tendency model predicted medium sanding potential in most of the target zone. The perforation depth ensured predominant upward fracture growth. The well, after perforating, flowed at a 18 MMscfd maximum rate with a 4,800 psi wellhead pressure.
Step rate and calibration tests estimated an average total near-wellbore loss of 400 psi at 40 bbl/min. The main fracture treatment proceeded according to design, achieving a maximum 1,650-psi net pressure vs. a 2,000-psi design.
A radioactive tracer survey before the coiled-tubing cleanout showed full coverage of the target zone.
A clean rate occurred after about 10 days (Fig. 4f), but the well was not produced to its maximum potential because of SMS temperature limitations. Maximum pressure drawdown was about 1,500 psi.
Cycling the well twice verified the clean rate. The flowback recovered 485 kg of total solids.
Well SA-7
Well SA-7, although successfully fraced, developed mechanical problems during the treatment; therefore, full testing was not possible and the results are inconclusive.
Fig. 4g shows the post-frac performance during the flowback period.
Total solids recovered, before the well was shut in for diagnosis of mechanical problem, was about 35 kg.
Well SA-8
The treatment in Well SA-8 was another success. The well, completed with 51/2-in. tubing in a 7-in. liner, had perforations at about 13,700 ft. Two distinctive net sands are in this well, but the lower one exhibits high water saturation, so that it was not treated because of the risk for water production.
Reservoir quality is good in the upper zone, with average 3.5 million psi Young's modulus. It also has layers with lower Young's modulus and high sanding tendencies.
The perforation depth ensured predominant upward fracture growth to maximize standoff from the high water saturation zone.
The well did not flow after being perforated.
Step rate and calibration tests, even with the oriented perforations, indicated total near-wellbore losses averaging about 300 psi, higher than in most other wells.
The main frac treatment proceeded according to design. The job achieved a maximum 1,500-psi net pressure vs. a 2,000-psi design.
The flowback achieved a clean rate after about 5 days (Fig. 4h). Maximum pressure drawdown was about 2,500 psi.
Cycling the well twice verified the clean rate. The flowback recovered about 33 kg of total solids.
Acknowledgments
The authors thank the management of Saudi Aramco for their permission to publish this article and Schlumberger for providing some of the material in this article. F
Bibliography
Ali, A.H.A., et al, "Advanced Hydraulic Fracturing Using Geomechanical Modeling and Rock Mechanics-An Engineered Integrated Solution," Paper No. SPE 68636, Asia Pacific Oil and Gas Conference and Exhibition, Jakarta, April 2001.
Al-Qarni, A.O., et al, "From Reservoir Specifics to Stimulation Solutions," Schlumberger Oil Field Review, Winter 2000/2001, p. 42.
Bartko, K.M., et al, "Implementing Fracturing Technology to the UKCS Carboniferous Formation," Paper No. SPE 38609, SPE Annual Technical Conference and Exhibition, San Antonio, October 1997.
Solares, J.R., "Efficient Technology Application to Optimize Deep Gas Well Completions in the Khuff and Jauf Formations Requiring Hydraulic Fracturing in Saudi Arabia," Paper No. SPE 68206, SPE Middle East Show, Manama, Bahrain, Mar. 17-20, 2001.
The authors
J. Ricardo Solares is a petroleum engineer specialist with Saudi Aramco in Udhailiyah, Saudi Arabia. He is involved with design and implementation of stimulation treatments as part of the massive propped hydraulic acid fracturing programs and with sand control efforts for the Ghawar field gas development projects. He previous worked for ARCO Oil & Gas Co. and BP PLC. Solares holds a BS in geological engineering and MS in petroleum engineering from the University of Texas and an MBA in finance from Alaska Pacific University, Anchorage.
Kirk Bartko is a stimulation specialist for Saudi Aramco in Dhahran, Saudi Arabia. He is responsible for developing and supporting new stimulation and completion technologies throughout Saudi Arabia. Prior to Aramco, he worked for ARCO Oil & Gas Co. Bartko holds a BS in petroleum engineering from the University of Wyoming.
Ali Habbtar is a production engineer with Saudi Aramco working in deep gas development related activities. His main focus is on acid fracturing in carbonate reservoirs and hydraulic fracturing for productivity enhancement and sand control in sandstone reservoirs. Habbtar holds a BS in petroleum engineering from Pennsylvania State University.
Optimization process
The workflow applied to each well was as follows:
Reservoir characterization
- Create a comprehensive database with existing and newly acquired data and incorporate local knowledge.
- Analyze and correlate available log and core data.
- Evaluate offset well data and history.
- Develop or improve mechanical rock properties, hydrocarbon resource profiles, and sand prediction models.
Well testing
- Analyze available pressure buildup tests and design new ones.
- Analyze existing production history and perform new tests when merited.
- Forecast performance for all treated wells.
Completion design
- Evaluate available cement bonds and recommend additional diagnostics when merited.
- Perform perforating modeling and issue optimum perforated interval recommendations.
- Recommend and implement appropriate new technology.
Stimulation design
- Develop comprehensive screenless completion guidelines applicable to local conditions.
- Design data-frac procedures and guidelines.
- Perform frac design and predict fracture properties.
- Issue fluid testing and quality control guidelines.
- Issue well flowback guidelines.
Stimulation job execution
- Perform quality assurance and control.
- Ensure design criteria and guidelines are followed.
- Perform data-frac analysis and revise fracture stimulation design.
- Supervise treatment implementation.
- Analyze fluid flowback data.
Post-treatment evaluation
- Analyze post-treatment data.
- Match production data and fracture properties.
- Refine and optimize models.
- Issue recommendations and develop action plan.
- Issue comprehensive summary for each well and document best practices.
- Apply optimized solutions to next well.
