Study says 2005 EU product specs may cost refiners up to $9 billion
Depending upon the final 2005 fuel specifications, the necessary European Union (EU) refining investment could be huge-as much as $9 billion, says a study by Nexant Ltd., London, formerly Bechtel Consulting.
The European Commission enlisted the firm to identify cost-effective measures to achieve the EU's proposed-air-quality targets. The project was one part of a major multidisciplinary exercise being overseen by the commission's Directorate-General for Energy and Transport and for the Environment.
EU air-quality goals will be among the most severe worldwide. They limit carbon monoxide, hydrocarbons, oxides of nitrogen, benzene, and particulate matter.
These targets will have an important impact on Europe's oil refining industry. The likely scenario for refiners includes investment in hydroprocessing and in yield shifting processes (such as catalytic cracking and hydrocracking). Individual refiners will make their own choices regarding what they must do to comply with the new requirements and remain competitive.
New projects in a limited span of time will have major implications for the process-engineering sector, which will be called upon to design and construct the required facilities.
The Nexant project team investigated two subject areas regarding improvement in air quality throughout the EU:
- The incremental capital and operating costs to the EU oil-refining industry depending on various possible 2005 gasoline and diesel specifications.
- Options offered by alternative fuels (including non-oil derived fuels).
This article describes the activities and findings of the first of these areas. When complete, the European Commission will post the full report on its website http://europa.eu.int/comm/dgs/energy_transport/index_en.html.
Development of specifications
The European Commission initiated the Auto-Oil Program I in 1993. At that time, the commission brought together the automobile and petroleum industries with the goal of developing an objective and scientific basis for the reduction of emissions from transport vehicles.
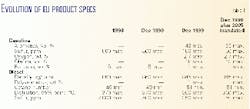
Table 1 summarizes the evolution of EU fuel specifications to date.
The tightening specifications required by 2000 required refiners to modify their existing facilities to meet the variety of product specifications. Although the commission has yet to decide the final specifications, the industry will likely be confronted with even tighter specifications, to take effect in 2005.
The commission has already mandated, however, that sulfur content should be a maximum of 50 ppm for both gasoline and diesel and aromatics a maximum of 35% for gasoline. It has set up a mini-review process to look further at the question of the sulfur level.
The automotive industry has supported these major step reductions in allowable sulfur content in gasoline and diesel fuel for 2005. By 2005, legislation will limit emissions from new vehicles. New technology after treatment devices, whose effectiveness is impaired by sulfur in the fuel, will help achieve limited emissions.
It has also been shown that a lower sulfur content results in lower particulate-mass emissions from diesel engines.
Today, the European Commission is still deliberating what oil-product specification packages should ultimately be adopted for 2005 and beyond.
Models and quality targets
The technical challenge of determining the costs of new fuel specifications was to assess the cost impact of tighter product specifications on more than 90 oil refineries in the EU. Nexant used linear-programming software to construct two models that represented the northern and southern regions of the European Union.
For each region, the firm configured notional refinery models for each of four generic types of refineries:
- Hydroskimming.
- Catalytic cracking.
- Hydrocracking.
- Catalytic cracking with hydrocracking.
Programmers developed and ran a base case specifying today's gasoline and diesel specification levels with the exception of known 2005 specifications to date. That is, the base case takes into account the new 2005 sulfur content in gasoline and diesel and the new aromatics content in gasoline.
This base case presented a considerable challenge to the EU refining system. It ultimately became a benchmark against which 11 variant cases were tested.
A general point of interest is that the accommodation of more light cycle oil in the middle distillate product will hamper attempts to improve the quality of diesel. This is the result of an anticipated reduction in demand for heavy fuel oil, which often uses light cycle oil as cutter stock.
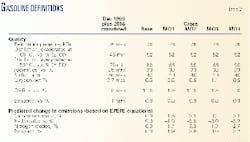
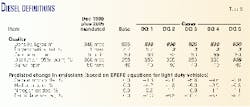
Tables 2 and 3 summarize the gasoline and diesel quality targets for each case, along with the predicted change in vehicle emissions resulting from their use. The shaded cells highlight qualities that are different from those of the base case. The quality targets relate to the desired market averages.
The team calculated the emission reductions on the basis of correlations (known as the EPEFE-or European Program on Emissions, Fuels, and Engine Technologies-equations) previously developed for the commission.
Process economics
To achieve the processing objectives required by the target fuel qualities, the model used the aggregate data concerning Europe's current refining configurations and added new facilities to them. Table 4 summarizes the estimated required total new capacity in the EU to satisfy the base case fuel qualities and to meet each of the variant cases.
Table 5 lists the additional costs associated with each case compared to the base case.
The capital costs are made up of two components: new facilities and modifications. The capital cost does not include costs of building new MTBE and methanol plants outside the refining sector and the addition of new infrastructure for transportation of product. These items are reflected in the operating margin.
The operating margin is the value of product minus the cost of feedstocks, utilities, and transportation costs. No financing costs or taxes are included.
The following sections are brief summaries of process aspects for each case examined. The heading for each gives the case number followed by the gasoline (MQ) and diesel (DQ) qualities package identifier according to Tables 2 and 3.
It should be emphasized that these cases only describe the aggregate EU position. Individual refiners will respond in their own way, given their own particular circumstances.
- Case 0, base-base. The base case for this Auto Oil II study uses year 2000 specifications with the more stringent mandated values for sulfur and aromatics in 2005.
The Auto Oil I Program set out gasoline and diesel specifications for 2000. The program also mandated specifications for aromatics and sulfur in gasoline and for sulfur in diesel for 2005.
Team members allowed the model to build any new process units required to meet the 2005 specifications in the most economic way. This included the latitude to add fuel oil conversion capacity, such as hydrocracking units and FCCUs, to simpler refining configurations, such as the hydroskimming refinery.
The results show that a substantial investment in new facilities is required to satisfy the base case. Part of this increase in capacity is driven by growth in the market for automotive fuels to the 2010 predicted in the commission's pre-Kyoto forecast covering years up to 2020.
Case 0 requires a substantial amount of gas oil desulfurization and dearomatization. Hydroprocessing is the most popular new-capacity addition, followed by hydrocracking and FCC. Additional processes to satisfy Case 0 qualities include alkylation and hydrogen production.
- Case 1: MQ1-base, gasoline E150 88 vol %. The most direct way to increase E150 is the production of more alkylate. Although producing more isomerate would also increase E150, the model is constrained to produce the same quantity of product, which biases it towards alkylate. There is approximately 10% more alkylation capacity.
CO2 emissions increase from all sources due to the large import of MTBE and the increased processing intensity.
- Case 2: MQ2-base, gasoline E150 90 vol %. Refiners can increase E150 by adding lighter components to the gasoline pool and removing heavier components. They can achieve this by more production of isomerate and alkylate.
Naphtha isomerization capacity increases by 23% and alkylate production increases by 29%. Feedstock supply for additional alkylate production may present difficulties for some sites where refinery and petrochemical facilities are integrated.
Case 2 increases CO2 emissions by 1.5%, mainly as a result of increased fuel consumption in the refinery.
- Case 3: MQ3-base, gasoline E150 88 vol %, oxygen content 1.1 wt %. The objective of Case 3 was to examine the effect of increasing E150 at the same time as the minimum oxygen content of the gasoline. Raising the oxygen content is achieved by addition of MTBE and other oxygenates.
The addition of substantial quantity of MTBE into the gasoline pool requires the reduction of other components.
TAME unit capacity increases to provide oxygenate. FCCU and alkylation capacities are slightly reduced compared to the base, displaced by the influx of MTBE.
CO2 emissions increase by approximately 4%. The increase is all associated with MTBE and methanol production in the petrochemical industry. CO2 from other sources is decreased.
- Case 4: MQ4-base, gasoline E150 90 vol %, olefin content 10 vol %. There is a reduction in utilization of the FCC gasoline hydrotreater as the olefinic material entering the gasoline pool is reduced.
Required new facilities for Case 4 include TAME capacity that reacts part of the light olefinic material with methanol to produce oxygenate.
Naphtha isomerization and alkylate production are increased by 34% and 44%, respectively. This reduces the amount of olefinic material and also dilutes it. Hydrocracking capacity is increased by 15%.
CO2 emissions increase overall. The main contributor to the increase is higher fuel consumption in the refining sector. The changes in the contribution from other sources are negligible.
There is a substantial capital cost associated with this case compared to Cases 1 to 3.
- Case 5: base-DQ1, diesel density 830 kg/cu m. Case 5 specifications require additional gas oil de-aromatization and hydrocracker capacity. Hydrogen production is increased by 13% to support the hydroprocessing operations.
Increased CO2 emissions come from the refining sector and a smaller contribution associated with power from the national grid.
- Case 6: base-DQ2, diesel density 830 kg/cu m, polyaromatic hydrocarbons (PAH) 3 wt %. Case 6 requires substantial new gas oil dearomatization capacity, which has the effect of reducing the polyaromatics and the density. The model, in fact, suggests a slight shift from hydrocracking to dearomatization to achieve the more stringent specifications. Hydrogen capacity increases by almost 20%.
Case 6 increases CO2 emissions by about 15% over the base case; most of this is a result of increased fuel consumption in the refinery sector.
- Case 7: base-DQ3, diesel density 825 kg/cu m, PAH 3 wt %. Case 7 requires additional gas oil de-aromatization and hydrocracking capacities. Alkylate production increases to compensate for the decrease in reformate production and to help meet the E150 specification. Hydrogen requirements increase by 31%.
CO2 emissions increase in Case 7 by 2.4% as a result of additional contributions from the refinery-fuel system and power imported from the grid.
- Case 8: base-DQ4, diesel density 830 kg/cu m, PAH 3 wt %, cetane number 55. The most notable feature of the new Case 8 facilities is the large amount of gas oil de-aromatization. New gas oil desulfurization is also significant. Hydrogen consumption increases by 25%.
CO2 emissions increase by 1.3%.
- Case 9: MQ1-DQ2, gasoline E150 88 vol %, diesel density 830 kg/cu m, PAH 3 wt %. In Case 9, the significant items in the new facilities required are additional gas oil dearomatization and alkylation capacity. Hydrogen requirements increase by 19%.
CO2 emissions increase by 1.6%. Fuel consumption in the refinery accounts for most of the increase; lesser contributions come from the other sources.
The combination of gasoline quality MQ1 and diesel quality DQ2 gives capital and operating costs almost equal to the sum of Cases 1 and 6. This suggests that meeting the MQ1 qualities provides little assistance in meeting those for DQ2, and vice versa. That is, broadly separate measures are required to meet the two sets of qualities.
- Case 10: MQ4-DQ3, gasoline E150 90 vol %, olefin content 10 vol %, diesel density 825 kg/cu m, PAH 3 wt %. Case 10 requires considerable additional processing facilities.
Naphtha isomerization increases by 22%. Gas oil de-aromatization capacity is up significantly compared to the base. FCCU capacity is marginally reduced and hydrocracker throughput increases by 42%.
Alkylate capacity increases by 37%, and hydrogen increases by 31%. Feedstock for this amount of alkylate may present difficulties for some refiners.
CO2 emissions are up 5.8% as a result of the increased processing intensity.
The capital and operating costs associated with this change are significant. The capital cost for new facilities is higher than in any other case. There is also severe deterioration in the operating margin.
- Case 11: base-DQ5, diesel density 830 kg/cu m, PAH 3 wt %, T95 335degrees C. The major additions of new facilities compared to the base case involve gas oil de-aromatization and hydrocracking. TAME production increases by 40%, and hydrogen increases 25%.
CO2 emissions increase by 4.7% with refinery fuel systems the main contributor.
The effect on the operating margin is significantly more detrimental than encountered in the other cases.
Costs
Table 5 summarizes the costs associated with each case. Costs are substantial. In most cases, the capital cost runs into billions of dollars. In the most extreme case, the capital cost exceeded $9 billion.
Incremental costs over the base case include the following components:
- Capital cost of investing in new facilities.
- Capital cost of modifications to the existing plant to enable them to handle more demanding operating conditions.
- Changes to operating costs arising from changes to purchases regarding products and utilities and from changes to freight requirements.
- Changes to maintenance, insurance, and other overhead costs.
- Storage charges of southern EU seasonal middle distillate surpluses, which cannot be accommodated.
The authors
Neil Richardson is associate consultant at Nexant Ltd., London. Prior to Nexant, he spent 24 years with BP in operational and strategic planning and 3 years at the Directorate-General for Energy of the European Commission, working on EU oil and gas strategy and assistance programs to former Soviet bloc countries.
Richardson holds a BSc in physics and math from the University of Edinburgh and a certified diploma in accounting and finance.
Pieter du Preez is senior process engineer with Bechtel Ltd., London. He specializes in planning and execution of refinery projects. He has more than 25 years' experience with engineering contractors in Canada and the UK.
Du Preez worked for Sante Fe Braun before joining Bechtel. He holds a BSc(Eng) in chemical engineering from the University of Witwatersrand, Johannesburg, and an MBA from the Middlesex University Business School, London.


