Technique characterizes permeability of stress-sensitive reservoirs
A technique has been developed to characterize permeability of stress-sensitive reservoirs as functions rather than unique numbers.
These permeability functions obtained by well testing may be thought of as an average of the drainage-area length. Hence, pressure-transient analysis provides large-scale estimates of the permeability function.
The functions are required for reservoir modeling of stress-sensitive reservoirs and describe the variation of permeability with pressure. This function may be obtained by integrating either core or well-test data and is required for high pressure and compacted reservoirs.
The proposed technique is independent of detailed core analysis. The assumption, however, is that the permeability-vs.-stress relationship observed on cores is similar in form to that derived from well tests.
Permeability functions
Any well test model for stress-sensitive reservoirs depends on a function that describes the variation of permeability with pressure. This function can be derived from laboratory experiments. A permeability-vs.-pressure relationship confirmed by core analysis is believed to be valid also on larger-scale lengths.
Under this assumption the well-test permeability function may be described by the same correlation as obtained from core analysis. But because of the larger scale, the equation is likely to be characterized by different parameters that may be determined by matching results from a well-test model to the observed pressure-transient behavior.
Permeability functions to be used in a well-test model should, if possible, have experimental support. Correlation accuracy should be acceptable for the individual as well as for the group of cores.
Generalized polynomials are the proposed method for selecting permeability functions.
A power transformed permeability, ke where: -1 < or equal to e < or equal to 1, may be fitted to the experimental results by polynomial regression. The exponent e = 0 is included in the set of power transformation as a logarithm, for example k0 = ln k.
Jensen discussed the use of the power transformations for permeability data for non stress-sensitive reservoirs.1
The arithmetic average polynomial function is easily adaptable because of the additive properties of polynomials. Depending on the transformation used, for example the exponent e, one can compute the arithmetic, harmonic, power law, or geometric average.
Generalized polynomials are flexible. Hence, they may be used to describe the response of the rock properties to large stress changes.
For a reservoir without stress sensitivity, the exponent e in the power transformation reflects how the regions of different permeabilities are connected, for example series, parallel, or random.2
The same may be true for a reservoir with stress sensitivity. Vairogs and Rhoades found that the last part of the Horner plot reflects the permeability at the initial or average pressure.3 Thus, there is little difference in the behavior of a reservoir with stress sensitivity and one without during the last portion of a buildup test.
Laboratory correlations
Many stress-sensitive properties are controlled by the effective stress, se. Equation 1 defines the effective stress where so is the overburden stress and a is the effective stress-law parameter.
The overburden stress, given by Equation 2, usually remains constant during a well test. Under these assumptions, the permeability becomes a function of pore pressure changes.
Several correlations in literature suggest that the permeability-vs.-stress relationship may be described by first-degree polynomials. These may be plotted as straight lines. Then one may determine the free parameters of the permeability function by linear regression.
Wyble found that the permeability pressure may be described by an exponential function, Equation 4.5 This equation may be displayed as a straight line on a ln k vs. Dp plot.Jones and Owens6 found that the permeability of stress-sensitive cores may be described by a power law function, Equation 5. This equation will be a straight line on a plot of kc vs. log se/sei.The conclusion reached by Jones and Owen was confirmed by Ostensen who obtained essentially the same result.7 He recommended using c = 1/2 rather than the c = 1/3 from Jones and Owen. The c = 1/2 exponent has a theoretical justification.8
Functions in the form of straight lines may have insufficient flexibility to describe a stress-sensitive formation's sensitivity to large pore-pressure changes. A major problem with straight-line correlations is that they may approach zero permeability prematurely.
The flexibility of the correlation, however, may be improved by adding higher-degree terms (Equation 6) that may extend the applicability range.
The same technique may be used for the exponential correlation proposed by Wyble (Equation 7). In another technique, Warpinski fitted a polynomial equation to experimental results obtained by core analysis (Equation 8).9
Equations 6-8 may be regarded as polynomials in log se/sei and Dp, respectively.One may use a higher-degree polynomial if justified by experimental results. Higher-degree polynomials, however, can lead to some oscillations that may be not be real.
Polynomials do accommodate curvature; hence, one may expect such functions to be better suited to describe complex behavior of stress-sensitive formations than a first-degree equation.
The authors recommend the use of the lowest degree polynomial that leads to an acceptable fit for the majority of cores.
Average permeability functions
One objective of conventional core analysis is to provide reasonable estimates of reservoir permeability. For pressure-sensitive reservoirs, the corresponding task is to obtain estimates of the permeability-pressure function.
The scale of the actual reservoir is much larger than that of core measurements. Hence, the reservoir permeability function may be thought of as an average of the permeabilities obtained from core analysis.
Many averages are included in the power-law average as special cases. If N core data are available, let index i denote the permeability at some reference pressure and j denote the number of the core.
For each j, one can approximate the power transformed data set by a polynomial function where P is some function of effective stress; for example, P = log se/sei in Equation 6 and P = Dp in Equation 7-8. Aj, Bj, and Cj are constants to be determined by polynomial regression for each core.One can judge the quality of the fit by the correlation coefficient r. A correlation coefficient r = 1 corresponds to a perfect correlation while r = 0 corresponds to no correlation. If the quality of the fit is satisfactory for all cores, one may proceed to calculate the arithmetic average for the group of cores where Equation 11 and the coefficients may be calculated from Equation 12.Solving Equation 10 for the permeability yields the power-law average, Equation 13, where index e denotes the exponent of the power transformation resulting in Equation 14.
Equation 14 includes traditional averages. For instance the arithmetic, and harmonic averages are included by the exponents e = 1 and e = -1, respectively.
The case when e = 0, which corresponds to the logarithmic transformation, must be treated separately; see Equation A10 and Equation A11. This equation corresponds to the geometric average. One can say that an average is consistent with a regression equation if the two are described by the same equation.10 Equations A1-A16 list some consistent pairs.
Core analyses from pressure-sensitive rocks are often presented in the form of tables. If one measures the results from all cores on the same pressure level, one may compute the average values directly for each entry in the pressure table.
The quality of Equation 13, therefore, may be checked by comparing the result against the corresponding average computed by the values in the table. These should be as close as possible. The conventional averages are the arithmetic (Equation A1), geometric (Equation A2), the power law (Equation A3), and the harmonic (Equation A4).
Approximate equations for average permeability functions may also be obtained by fitting polynomials to the average values computed for each pressure level in the table. Then it is difficult, however, to assess how representative the regression equation is for the individual cores.
Hence, we prefere to compute average functions based on analysis of individual cores.
Core analysis
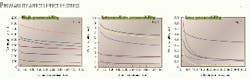
Permeability data from 19 cores were available. All showed some sensitivity to changes in the effective stress, se. Figs. 1a-1c show the degree of stress-sensitivity.The report included eight permeability measurements in the range 15 to 450 bar effective stress. All cores are from the same well but from different zones.
A regressional analysis obtained an approximate permeability function of the power-law type, k^j vs. either se or Dp, for each core. The quality of the fit for each core was judged by the correlation coefficient.Based on the results from single core analysis, the corresponding average function was computed with Equation 13 and also directly from the values in the table values. The quality of the fit for the group of cores was judged by comparing the average values. A single graph shows the normalized permeability functions, kn = k/ki.
The results for each core were matched to the correlations of Jones and Owens,6 Equation 5, and Wyble,5 Equation 4. These correlations are consistent with the power law and the geometric average respectively.
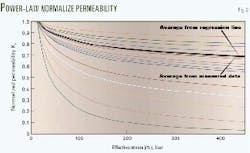
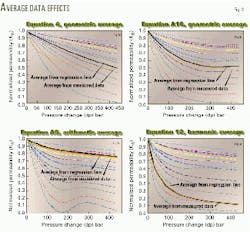
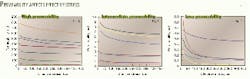
Fig. 3c shows the result obtained by a third-order polynomial regression equation (Equation 8). Some oscillations can be seen. The correlation coefficients, however, are excellent.
The inverse of the permeability was matched to a polynomial of third degree, Equation A13. This regression equation is consistent with the harmonic average. Fig. 3d shows the resulting permeability function.
Well-test permeability function
Upscaling of laboratory results from cores with pressure sensitivity is more complicated than for cores without. Even if the expected pressure sensitivity for a group of cores may be known from core analysis, the interaction of regions with different pressure sensitivity in the reservoir is not well understood. The results from core analysis, therefore, may not be used directly in reservoir analysis.
Changes induced by drilling, handling, and transportation may further complicate the upscaling procedure.
An alternative to upscaling is to derive the permeability function by well test interpretation. A well test model, however, depends on the existence of a permeability function. The permeability function could be assumed or based on results from core analysis. In either case the unknown coefficients may de determined by matching the well-test model response to the observed pressure-transient behavior.
If core analysis is available, the latter approach is preferred because the selected permeability function has experimental support.
Due to the non-uniqueness of the well test pressure signature, it is important to have the stress-sensitivity of the formation confirmed by core analysis.
Kikani and Pedrosa11 showed that the permeability modulus, g, may be obtained by conventional type curve matching on real well-test data. Their study was based on the Wyble correlation (Equation 4).A Horner analysis determined the initial permeability. Jelmert12 pointed out that the same approach may be used for Jones and Owens correlation (Equation 5). If the stress-sensitivity in the well-test model is based on polynomial of second degree or higher, the unknown parameters may be determined by non-linear regression.
Upscaling
Many correlations may be derived from core analysis by using polynomials. All the traditional averages may be generated. These are complementary in the sense that they lead to alternative answers which provide a range of possible functions that the well-test permeability function may be compared against.
It is possible to judge the quality of proposed correlations both for individual cores and a group of cores.
Laboratory experiments on a group of cores may help selecting permeability functions to be used in a well-test model. Average permeability functions may be estimated. The calculation is not intended as an upscaling technique although it could be used for this purpose.
We recommend upscaling by well testing. The well-test pressure match leads to an estimate of the permeability function on the larger scale of well testing. Such a function may be useful to predict future production.
References
The authors-

Tom A. Jelmert is professor of petroleum engineering at the Norwegian University of Science & Technology, Trondheim. He previously was a research engineer at SINTEF, Trondheim, and an adjunct professor of mathematics and physics at the Academy of the Royal Norwegian Air Force. Jelmert holds a BS in electrical engineering from Purdue University and an MS and PhD in petroleum engineering from the Norwegian Institute of Technology.

Harald Selseng is reservoir engineering advisor for Technoguide as, Oslo, where he works in developing 3D reservoir modeling programs. He previous worked for Saga Petroleum ASA. His experience includes well test interpretation and operations, reservoir simulation studies, and production technology. Selseng has a BS in natural gas engineering from Salford University, UK

Ole Torsæter is A professor in reservoir engineering in the petroleum engineering and applied geophysics department of the Norwegian University of Science & Technology. Previously, he worked for SINTEF and ResLab. Torsæter holds an MS and a Doctor of Engineering in petroleum engineering from NTNU.