NMR tools afford new logging choices
Nuclear magnetic resonance (NMR) logging has matured during the 1990s and offers the petroleum industry a method for determining bypassed pay, hydrocarbon content, and formation permeability.
These logs are no longer an experimental or specialty wireline technology but are key to openhole formation evaluation and have become part of the standard wireline suite for many companies. In some cases, companies have replaced neutron-density and other logs with NMR logs.
As with any tool, data should be evaluated as part of the total formation evaluation program. For example, if no database for the formations being logged exists, it may be advisable to calibrate the NMR bound fluid and permeability with core or test data.
NMR logs provide answers that range from simple bound-fluid measurement to complex fluid characterization. But some pre-job planning is required to determine the type of answers needed and how these answers might be obtained.
NMR tool theory
In NMR tool theory, the important points to understand are spin echoes, T2, NMR porosity, T2 distribution, bound-fluid models, permeability models, and log display.
Spin echoes
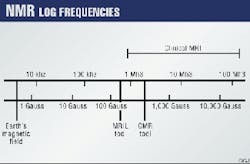
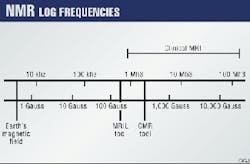
NMR logging tools contain the same two key elements as medical MRI devices, namely a magnet and a radio frequency transmitter and receiver. For resonance to occur, the transmitted radio frequency energy must be at a specific frequency called the "Larmor frequency." Fig. 1 shows the static magnetic field strength and relationship to operating frequency for hydrogen.
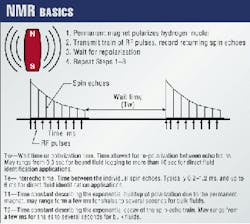
NMR logging involves three steps:
- A permanent magnet aligns (polarizes) hydrogen nuclei. The polarization involves an exponential buildup et/T1.
- A transmitted radio frequency (RF) field manipulates the nuclei. Each RF pulse "flips" the nuclei. After each flip, energy returns to the antenna (receiver coil) in the form of spin echoes. The function e-t/T2 describes the echo decay.
- After RF pulsing terminates, the nuclei realign with the permanent field during the wait time (Tw).
Fig. 2 shows the repetitive process of nuclei alignment with the permanent magnet, pulsing with radio waves, recording of spin echoes, and realignment with the permanent magnet. After each train of spin echoes, realignment or polarization of the nuclei takes place during the wait time.
Tw is a key operational parameter. The Tw should be long enough to allow for full polarization. Otherwise, the reported porosity would be too low. On the other hand, a long Tw slows logging speed.
The wait-time problem is the reason that NMR logging was originally very slow. But logging speeds have become faster as service companies have devised ways for circumventing the wait-time problem.
Spin echoes to T2
The echo train may contain various decay rates that reflect effects of various pore sizes, fluid interactions, and surface mineralogy. Basically, T2 describes echo decay steepness and has been observed to be a function of:
- Pore size distribution. Large pores are associated with a long T2.
- Fluid type. Light oil has a long T2, and heavy oil and gas have a short T2.
- Relaxivity. Surface mineralogy affects relaxivity. More clay and other debris on pore surfaces, for example, lowers T2. Carbonates generally have cleaner surface mineralogy and therefore a lower relaxivity and a longer T2.
T2, therefore, provides a useful snapshot of pore size, although it is also affected by fluid type and surface mineralogy.
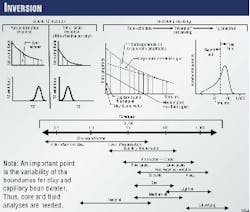
Inversion processing solves for the various decay components within the echo data (Fig. 3).
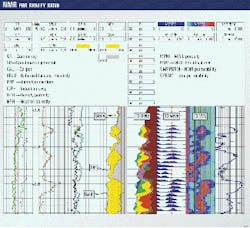
The T2 distribution may be shown as porosity "bins," a waveform trace, or as a variable density (VDL) display (Fig. 4). The bins are discrete slices of T2 data. For example, the log may show T2 bins at 4, 8, 16, 32, 64, 128, 256, and 512 ms.
NMR porosity
The area under the T2 distribution equals NMR porosity. The porosity is said to be lithology independent because the NMR tool counts hydrogen without regard to whether the hydrogen is in sandstone, carbonate, or other formation.
NMR porosity, however, can be lower than total porosity in the presence of light hydrocarbons. It will also read a lower porosity if Tw was insufficient or in the presence of materials having a very low T2, such as clay-bound water or heavy oil.
Older NMR tools (pre-1996) could not detect the very short T2 associated with some clay-bound water. The NMR porosity on these older logs often read very low values (1-3 porosity units) in shales. This NMR porosity was thought by many to reflect effective porosity.
After 1996, advances in NMR tool technology (MRIL C-total porosity, CMR-200) have allowed the measurement of a shorter T2. This generation of tools is sometimes referred to as "total porosity" NMR logging tools. Modern NMR logs typically report both an effective and total porosity.
Much research still focuses on the T2 boundary between the clay bound and capillary-bound water. This boundary may vary depending on clay type and distribution.
T2 distributions
As previously mentioned, T2 reflects pore size, fluid type, and surface relaxivity. Fig. 3 shows typical T2 values for various fluid and pore system combinations.
The measured T2 (T2R) is the sum of surface T2 (T2S), bulk T2 (T2B), and T2 of diffusion (T2D), as follows:
1/T2R = 1/T2S + 1/T2B + 1/T2D
T2S is the dominant relaxation mechanism for water-filled pores in water-wet rocks. In this case, T2S is related to the ratio of surface area (S) to pore volume (V) and is governed by surface relaxivity (p) by the following equation:
1/T2S = p(S/V)
Surface mineralogy governs the surface relaxivity.
T2B is controlled by the precessing protons interacting with neighboring protons and is governed by the fluid properties. T2B has been shown to be strongly related to oil viscosity.
The movement of precessing protons from one location to another governs T2D. This is the dominant relaxation mechanism for gas and is a function of inter-echo spacing (Te), gyromagnetic ratio (g), and gradient (G), as follows:1/T2D = D/12 (gGTe)2Bound-fluid models
The real beauty of NMR logging is its ability to infer bound and free-fluid amounts. Obviously, these values are a key for determining a formation's hydrocarbon content and producibility.
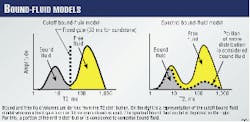
For years, logs have been used to determine porosity but just as important is to determine the amount of movable fluid. The amount of bound fluid volume (BVI) can be computed from the T2 distribution by such methods as (Fig. 5):
- Cutoff method. With this method, all of the porosity associated with a T2 lower than the cutoff value is considered to be bound fluid. Typical cutoff values are 33 ms for sands and 90 ms for carbonates.
- Spectral methods. With this method, a portion of each T2 bin comprises BVI. These methods include spectral BVI model (Halliburton), film BVI model (Baker Atlas), and tapered BVI model (Schlumberger).
Permeability models
NMR log T2 can indicate pore size, and pore throat size controls permeability. If there is a relationship between pore size and pore throat size, as there often is for clastics, then NMR provides a very good link to permeability. NMR permeability (k) can be computed from methods such as:
Timur-Coates Model. Computed from porosity (f) and the free fluid volume (BVM) to bound fluid volume ratio, as follows:k = (f/C)A(BVM/BVI)B- Kenyon Model. Computed from porosity and the logarithmic mean T2 (T2LM).
Both permeability models provide satisfactory results, particularly in clastics, although the Kenyon equation can be affected adversely by a fluid change in the formation because oil can have an effect on T2.
Existing data, core measurements, and production tests can refine the bound-fluid models and permeability coefficients.
Log display
Fig. 4 displays log response in a sand-shale sequence. For comparison, the display includes the standard triple combo logs in the first three tracks. The fourth track is the NMR porosity, with yellow being the free fluid and gray being the bound fluid.
The next track, T2 bins, displays the amount of porosity that falls into each preselected time slice. The T2 bins start with the highest to lowest T2 values displayed from left to right with the following color code: Light blue-512 ms, dark blue-256 ms, green-128 ms, and yellow-64 ms. These then range down through 32 ms, 16 ms, 8 ms, and 4 ms.
This bin display could be thought of as representative of pore size distribution, but it must be remembered that there are significant fluid and surface mineralogy effects on the T2 distribution.
The next two tracks show T2 as a wave trace and as a variable density display in which the color represents amplitude. Red is the highest, light blue the lowest amplitude. The logarithmic wave and VDL time scale are from 1 to 1,000 ms.
The wave track includes a line dividing the bound and free fluid. In this case, it is at 33 ms.
The track on the right shows NMR permeability along with sidewall core permeability.
NMR tool designs
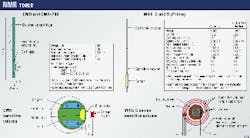
Two NMR tool designs are commercially available (Fig. 6). The tools are fundamentally different, but most formation evaluation problems can be handled by either tool, although they may require different interpretation techniques or in some cases need to be complemented with conventional logs.
Choosing wisely among tools available for a particular situation requires an understanding of the basic tool differences.
The magnetic resonance imaging log (MRIL) was developed by Numar Corp. and began to be commercially used in 1991. Numar licensed the MRIL to Computalog Ltd., Baker Atlas, and Halliburton.
In 1997, Halliburton purchased Numar Corp. but the MRIL is still available from Computalog and Baker Atlas.
The original commercial Numar design was the B series. This was followed by the C series in 1994, C-TP series (total porosity) in 1996, and the Prime tool in 1999. Each design offered major improvements in logging speed and acquisition capabilities.
For example, the Prime tool's logging speed is about 10-times faster than the original B tool, while it simultaneously gathers several data sets with better repeatability.
The combinable magnetic resonance (CMR) tool is a Schlumberger design commercialized in 1992. In 1996, the tool was upgraded to the CMR-200, a total porosity version with improved signal to noise characteristics. In field test is the CMR plus tool, a major design modification that is reported to offer faster logging speeds compared to the standard CMR.
CMR major features
The CMR is a pad mounted tool that is 14-ft long, weighs 300 lb, and has a 5.3-in. diameter. The tool can be combined with most Schlumberger logging tools. While moving, it has a bed resolution of 1-2 ft and is more sensitive to hole rugosity than the MRIL. Logging in saline muds is generally not a problem.
In the bound-fluid mode, the CMR logging speed is similar to a neutron-density logging speed, but the CMR is much slower than the MRIL for the same wait time.
To log at higher speeds, the CMR data are sometimes acquired in a bound-fluid logging mode. This technique uses a shorter wait time to increase logging speed. This technique can obtain an accurate bound-fluid volume, but the free-fluid volume is typically under-estimated.
In this case, an external porosity tool such as a neutron-density can be used. Another technique is to use an intermediate wait time with a polarization correction factor to correct the free-fluid volume.
A comparison of CMR porosity with density or sonic porosity is the preferred method for direct hydrocarbon identification. Direct hydrocarbon identification applications such as shifted spectrum and differential spectrum are possible with the CMR but are not often used commercially.
Because of the tool's focused field, the tool requires, more tuning time downhole, compared to the MRIL, for obtaining optimum resonance frequency. The focused field may require occasional retuning downhole because the static field strength changes with temperature.
Calibration and mud checks of the CMR are simple wellsite operations.
The CMR is often run to complement triple combo logs rather than replace other porosity tools.
MRIL major features
The MRIL is a mandrel-type tool that is more than 50-ft long and weighs more than 1,000 lbm. It is available in 4.5, 4 7/8, or 6-in. diameters. The tool can be combined with most Baker Atlas, Computalog, and Halliburton logging tools. Also, it can be combined with Schlumberger tool strings (sequential logging) by a switching sub.
The MRIL bed resolution of 3-5 ft is less than the CMR, but it handles borehole rugosity better.
The MRIL gradient field allows multifrequency operation. This circumvents the wait time problem by allowing up to nine simultaneous readings.
Saline muds lower the tool's logging speed, and sodium resonance can be an issue.
Because of the tool's large sensitive volume and gradient field, it has better performance in advanced applications such as shifted and differential spectrum.
The MRIL can be quickly and simply tuned downhole. Its primary calibration is in a large Faraday cage that is not at the wellsite.
MRIL logs typically supplement traditional logs but the logs have successfully replaced neutron-density and resistivity logs, in some cases.
The Prime version of the tool offers advanced applications such as obtaining total porosity and hydrocarbon identification in one pass, at up to 24 fpm.
The MRIL has a gradient field that allows multiple frequencies. If the transmitted frequency is decreased by a few kilohertz, resonance occurs at a slightly lower field strength, which is present somewhat farther from the tool.
Fig. 6 depicts an operation at three different frequencies, which results in sensitive volumes in three concentric shells surrounding the tool. In practice, the shells are about 1 mm thick and 1 mm apart with a frequency difference of a few kilohertz.
Operation at multiple frequencies allows faster logging and the capability of obtaining data with various echo spacing (Te) and polarization time. The gradient also simplifies the task of "staying on frequency" as the magnetic field strength changes with temperature.
Fig. 6 depicts the C tool, with triple-frequency capability. The newer Prime tool offers nine-frequency operation.
NMR applications
NMR applications fall into two main categories:
- Reservoir characterization, including total and effective porosity, bound and free fluid volumes, permeability, pore size distributions, clay characterization, etc.
- Fluid characterization, including direct hydrocarbon typing or detection. The fluid characterization solves for hydrocarbon volumes (near wellbore) independent of resistivity analysis.
Log results may be presented in the following products.
- NMR field log. These presentations generally include NMR total and effective porosity, bound fluid or free-fluid volumes, permeability and a T2 distribution either as a wave or VDL display or as porosity bins. It may also include quality control curves. Quality control curves and a full listing of acquisition parameters are essential.
- Integrated saturation analysis products. These include the CMR Quicklook/ELAN (Schlumberger), MRIAN (Halliburton), MRAX (Baker Atlas). The basic NMR logs report bound vs. free-fluid volume. Integrated analysis logs use resistivity analysis to determine whether the free-fluid volume contains hydrocarbons or water.
A bulk volume water (BVW) is computed and overlain with the bound-fluid volume from the NMR log. The formation is likely to produce water if the BVW is greater than the bound-fluid volume. Formations that produce water free should show agreement between BVW and bound fluid.
Each product has a particular approach to the integration of conventional and NMR data, but correct formation electrical properties, Rw, and proper compensation for excessive conductivity due to clay are the real keys to a valid result.
Core analysis for calibrating the NMR T2 cutoff values is also important. Total porosity NMR data are valuable input but should be correlated to scanning electron microscope (SEM) and X-ray diffraction (XRD) core data.
- Fluid identification from NMR. This really describes an acquisition mode with an associated computed product. These products can provide near wellbore fluid identification and saturation without any dependence on resistivity analysis. In the rare case of no flushed hydrocarbons, these products could provide direct hydrocarbon saturation.
Because some flushing occurs in nearly all cases, the saturation obtained is for a flushed zone hydrocarbon saturation. These products, therefore, usually are complemented by resistivity-based analysis.
Nevertheless, a direct hydrocarbon type and saturation indication is of tremendous value to the log analyst. This NMR saturation is independent of Rw, shaliness, and formation electrical properties. Four direct hydrocarbon identification and saturation techniques include:
- Time Domain Analysis (TDA)1. This analysis uses data recorded at two different polarization times. It is used for light hydrocarbon typing and saturation.
- Density Magnetic Resonance (DMR)2. This method compares NMR porosity to density (or sonic) porosity for gas identification.
- Shifted Spectrum (SSM)3. This technique uses multiecho spacing data and is applicable in certain light-oil viscosities.
- Enhanced diffusion (EDM)4. This method uses a dual Tw with longer inter-echo spacing to enhance the oil signal's visibility and is used in direct fluid identification of light oil.
All four techniques can be done with either tool design but Techniques 1, 3, and 4 are primarily identified with the MRIL, and Technique 2 is primarily identified with the CMR.
For these techniques to work properly, there must be some amount of residual hydrocarbon available for measurement in the sensed volume of the NMR device. This rules out formations with low gas pressure, low porosity, and complete flushing.
For all these cases, job planning is necessary. The type of technique selected depends on the tool, the formation evaluation challenge, the amount of time available for logging, etc.
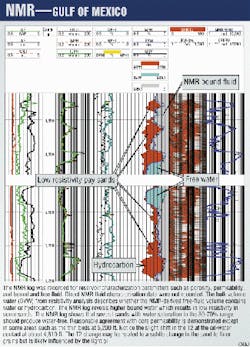
Figs. 7 and 8 show examples of the effectiveness of NMR logs. Fig. 7 includes a triple-combo data set in a shaley sand sequence in the Gulf of Mexico. Wet zones and prospective pay zones are visible. Some zones have intermediate resistivity and may not typically be counted as reserves.
The NMR log reveals the dramatic changes in texture between the various sand intervals. The integrated analysis shows that all zones with intermediate resistivity should produce hydrocarbons without water.
Sidewall core permeability is displayed for comparison to that from NMR.
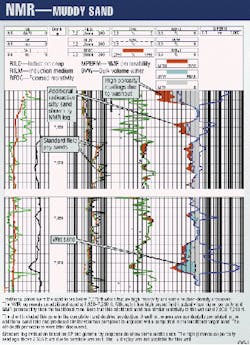
Fig. 8 presents an example of tight gas sand (Muddy) in which bypassed pay was identified.
References
- Prammer, M.G., et al., "Lithology-independent gas detection by gradient-NMR logging," Paper No. SPE 30562, SPE Annual Technical Conference and Exhibition, 1995.
- Freedman, et al., "Combining NMR and Density Logs for Petrophysical Analysis in Gas-Bearing Formations;" Paper II, 39th Annual SPWLA Logging Symposium, 1998.
- Akkurt, R., et al., "NMR Logging of Natural Gas Reservoirs," 36th Annual SPWLA Logging Symposium, 1995.
- Akkurt, R., et al., "Enhanced diffusion: expanding the range of NMR direct hydrocarbon-typing applications," Paper GG, 39th Annual SPWLA Logging Symposium, 1998.
The Author
Brian Stambaugh is president of NMR Petrophysics Inc., Houston. He previously worked for Schlumberger and Numar Corp. At Numar, his work involved development of new computational techniques for NMR data and marketing and engineering efforts. He also has been a technical and marketing consultant to Computalog, Atlas Wireline, and Halliburton Logging Services.
Currently, in addition to teaching, he performs petrophysical field studies and consults on NMR logging. Stambaugh holds a BS in mechanical engineering from the South Dakota School of Mines & Technology.
