New approach calculates deepwater gas-lift valve dome pressure
A new approach for calculating the dome pressure for nitrogen-charged, gas-lift valves placed in deepwater wells provides more general and precise numerical values than previous correlations.
The need for tables can be avoided with the new approach because it does not depend on test-rack temperature. Moreover, it is especially suited for computer applications because its analytical feature ensures low computational cost.
Gas lift
Gas lift is one of the most important artificial lift methods, especially for offshore wells. In this method, gas at a high pressure is injected into the tubing or tubing-casing annulus, and its flow rate, during kick-off or production periods, is controlled by gas lift valves in the tubing string.
A bellows-charged, gas-lift valve is the most common type.1 The presence of a chamber filled with nitrogen (the dome and bellows, responsible for the closing force of the valve) introduces the problem of calculating the pressure at the wellbore temperature, or vice-versa. The pressure is known only at a reference temperature.
Winkler established a simple correlation to calculate these dome pressures.2 This correlation has been widely used for decades. But current compressor discharge pressures in closed gas-lift systems have increased to allow gas injection as deep as possible.
Winkler and Eads concluded that previous approaches introduced significant errors when used in such high-pressure levels and developed a new correlation.3
In Petrobras' deepwater scenario, the lift-gas pressure is very high, thus requiring accurate algorithms for gas-lift computer simulators.4 To obtain a better approach, Petrobras selected a generic cubic equation of state that is fitted against tabulated nitrogen-compressibility factors. This approach avoids the usual trial-and-error procedures and limited correlations.
As suggested by Baruzzi,5 the Peng and Robinson (P-R) equation of state6 was adopted to start the development of the approach.
This article uses the International System (SI) of units along with absolute values of pressures and temperatures.
Original P-R equation
Peng and Robinson6 proposed a cubic equation of state such as Equation 1. (See accompanying equations box.) In the equation, P is pressure, T is the temperature, v is specific volume, R is the gas constant, and a and b are parameters dependent on the gas.
Equation 1 can be rewritten as Equation 2, after defining Z = Pv/(RT).
Equation 1 applied at the critical point, where the first and second derivatives of pressure with respect to volume vanish, yields Equations 5 and 6.
At other temperatures, one obtains Equation 7 and 8, where k is a constant characteristic of each substance and correlated6 against the acentric factor w (for nitrogen7w = 0.03632, calculated from its definition, and k = 0.4303).Moreover, the other values are R = 296.7 J/(kg-K.), Tc = 126.25 K., Pc = 3.396 MPa, and vc = 0.003289 cu m/kg. These values yield a (Tc) = 188.9 Pa-m6/sq kg and b(Tc) = 0.0008581 cu m/kg.
A cubic equation allows for analytical calculation of its roots7 and Equation 2 has one or three real roots, depending upon the number of phases in the system. The largest root is the vapor compressibility factor in the two-phase region.6
For example, if P = 20 MPa and T = 400 K., the resulting cubic equation is Z3 - 0.855393Z2 - 0.233553Z + 0.00681437. This yields the roots 1.0068, -0.23935, and 0.026656. The first one is the correct z-factor value.
If one considers 0.1 MPa < or equal to P < or equal to 40 MPa and 250 K. < or equal to T < or equal to 450 K. as the pressure and temperature ranges of interest, the original P-R equation gives a maximum absolute deviation of 6.6% and an average absolute deviation of 1.5% from tabulated z-factor data.7
Z-factor
No cubic equation of state could satisfactorily represent all thermodynamic properties simultaneously.6 8 The goal here is to obtain a cubic equation, departing from the P-R original equation, that yields accurate values of z for the required ranges of pressure and temperature.
Hence, Equation 9 is proposed. The B2, B3 have similar definitions as B1 (only replacing the indexes) and C = c.
From the 60 tabulated z-factor values7 available for the ranges of interest, commercial computer software found b1, b2, b3, c, l, and d. This yielded the minimum average absolute error.The optimized parameters were b1 = 0.00111351 cu m/kg, b2 = 0.000239076 cu m/kg, b3 = 0.000814230 cu m/kg, c = 0.999786, l = - 0.217649 Pa-m6/(sq kg-K.), and d= 179.319 Pa-m6/sq kg.Application of these coefficients to the pressure and temperature ranges of interest yields a maximum absolute deviation of 0.24% and an average absolute deviation of 0.061%.
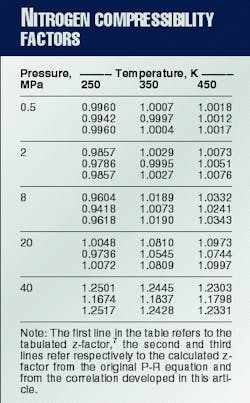
Table 1 compares the tabulated against the calculated z-factors for some P and T values.
Converting dome pressures
The problem, basically, may be described as follows: Given an initial condition characterized by a pressure Pi and a temperature Ti, calculate the new pressure Pf for a new and known temperature Tf , considering an evolution at constant volume. From this, one can develop Equation 13.
Equation 13 requires a trial-and-error procedure because Zf depends on Pf. An equation of state such as Equation 9, however, is a straightforward and accurate relation that eliminates the usual trial-and-error procedure.
To convert dome pressures of gas lift valves from the surface conditions to well conditions or vice-versa one has to analytically calculate Zi from Equation 10, vi from Equation 13, and Pf from Equation 14.
Comparisons
The traditional approach to convert gas-lift valve dome pressure is by using a Ct factor, defined as the ratio of Pb (dome pressure at 288.7 K. (60
Winkler2 developed one of the first equations for Ct, Equation 15, in which F = 0.00387 K-1. This expression has been used to develop Ct tables, such as those in API RP 11V6.9
Winkler and Eads3 observed that in systems with high injection-gas pressures, the Ct factors introduced errors that may prevent successful gas lift operations. The new proposed correlation is based on compressibility factors published by the AGA10 and considers F as a function of Pb (Equations 16 and 17).
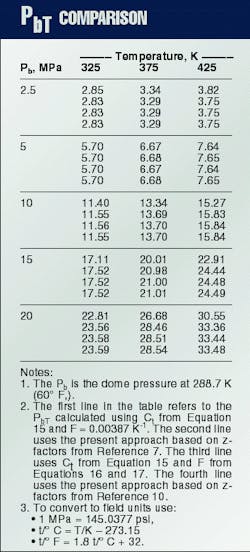
Table 2 compares the PbT values obtained from the traditional Ct procedure with those calculated with the Winkler and Eads procedure3 and the present approach. As pointed out by Winkler and Eads, the error introduced when applying the usual Ct procedure increases as the reference dome pressure increases.3
The calculated opening pressure is lower than the actual valve opening pressure, which may prevent the valve from opening with the available injection pressure level. The differences between the values calculated using the procedure presented here (Table 2, Line 2) and the equations given by Winkler and Eads3 (Table 2, Line 3) are mainly due to differences between the adopted z-factor table. This is seen if the present model is fitted to AGA's z-factor table10 (Table 2, Line 4).
The corresponding optimized parameters are b1 = .00116647 cu m/kg, b2 = 0.000221353 cu m/kg, b3 = 0.00103402 cu m/kg, c = 1.00000, l = -0.200433 Pa-m6/(sq kg-K), and d = 179.902 Pa m6/sq kg).Although the procedure given by Winkler and Eads3 yields good numerical values, the new approach discussed in this article is more general, precise, and elegant. It does not depend on the particular choice of the test-rack temperature, thus avoiding the need for tables.
Moreover, it is especially suitable for computer applications due to its analytical feature that ensures low computational cost.
The nitrogen z-factor correlation used in the approach has been determined to be accurate and may also be applied in other applications.
References
- Brown, K.E., The Technology of Artificial Lift Methods, Vol. 2a, PennWell, Tulsa, 1980, pp. 96-123.
- Winkler, H.W., "Here's How to Improve Your Gas Lift Installations-Part 6: The Use of Gas Lift Valve Specifications and Force Balance Equations," World Oil, January 1960, pp. 129-35.
- Winkler, H.W., and Eads, P.T., "Algorithm for More Accurately Predicting Nitrogen-Charged Gas-Lift Valve Operation at High Pressures and Temperatures," Paper No. SPE18871, 1989.
- Almeida, A.R., and Slobodcicov, I., "Continuous Gas Lift Performance Analysis," World Oil, September 1998, pp. 91-96.
- Baruzzi, J.O.A., Personal communication, Campos Basin Artificial Lift team, E&P-BC/GESCOM, 1999.
- Peng, D.Y., and Robinson, D.B., "A New Two-Constant Equation of State," Industrial Engineering Chemical, Fundamentals., Vol. 15, No. 1, 1976, pp. 59-64.
- Perry, R.H., Green, D.W., and Maloney, J.O. (editors): Perry's Chemical Engineers' Handbook, 6th edition, McGraw-Hill, 1984, pp. 2-15, 3-17, 113, 209, 267.
- Yu, J.M., Adachi, Y., and Lu, B.C.Y., "Selection and Design of Cubic Equations of State," in Chao, K.C. and Robinson, Jr., R.L. (editors), Equations of State-Theories and Applications, ACS Symposium Series 300, ACS, 1986, pp. 537-59.
- American Petroleum Institute, Recommended Practice for Design of Continuous Flow Gas Lift Installations Using Injection Pressure Operated Valves, API RP 11V6, 1st Edition, 1992.
- Eilerts, C.K., et al., Monograph 10 Bureau of Mines, Vol. 2, AGA, 1959, pp. 761-64.
The Author
Alcino Resende Almeida is a senior research engineer with Petrobras R&D Center in Rio de Janeiro, Brazil. He is involved with modeling and computer simulations of gas lift systems. He joined Petrobras in 1984 and worked both as a field and designe engineer, mainly in the artificial lift area, prior to joining CENPES in 1988.
Almeida holds a BS and an MS in mechanical engineering from the Federal University of Rio de Janeiro.

