New transmission-factor formula proposed for gas pipelines
Joint research involving four European natural gas transmission companies has yielded a new transmission-factor formula as an alternative to the well-known Colebrook-White formula.
Among other benefits, the very general formula has the potential to become widely accepted in giving a reliable theoretical foundation for pipeline planners and simulation tools.
Colebrook-White formula
A crucial issue in predicting flow in gas pipelines is the proper choice of the formula for the transmission factor. Over several decades, the well-known Colebrook-White formula1 has widely been used (Equation 1 in accompanying equations box).
The friction factor (l) is defined as shown in Equation 2 in which uw = the mean wall shear stress averaged over the circumference of the pipe and r = the gas density.Two limiting cases for Equation 1 can be distinguished:
Consequently, the relative roughness can be determined with this equation by measuring the transmission factor in the fully rough flow regime. In other words, the roughness (k) is defined in an hydraulic rather than a geometric sense.
It is worth mentioning that Equation 1 is sometimes used in a slightly modified form by changing the constant 2.51 into 2.818 to achieve better agreement with experiments at higher Reynolds numbers.2
Operating pipelines' data
Data collection of operational gas pipelines carried out by the AGA3 showed transmission-factor characteristics that differ considerably from those calculated with the commonly used Colebrook-White equation.
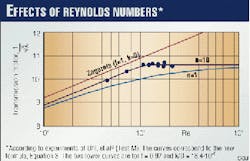
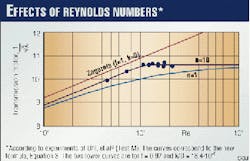
These measurements showed also that there are qualitative differences in the behavior of the transmission factor as a function of the Reynolds number. Similar tests in France agreed with those in the US. A typical result is shown in Fig. 1.
The main characteristics of the transmission-factor curves are as follows:
- At low Reynolds numbers, the curves do not agree with the smooth pipe law but are nearly parallel to it.
- At a certain "critical" Reynolds number, the curves turn into horizontal lines consistent with the fully rough flow regime.
It should particularly be noted that the change from smooth to fully rough flow is abrupt (= "point transition") rather than gentle as described by the Colebrook-White formula.
With the exception of the low Reynolds-number regime, the curve n = 1 in Fig. 1 practically coincides with the Colebrook-White formula. Hence, the data of the operational gas pipeline shown in Fig. 1 deviate up to 6% from the corresponding values predicted by the Colebrook-White formula.
Such a large difference cannot be tolerated in practice.
In the following discussion, a new formula will be proposed which covers the data considerably better. A possible explanation for the difference between the data and the Colebrook-White formula will also be given.
New formula
A new formula (Equation 3) for the transmission factor describes all the characteristics mentioned previously. It has the following features and benefits:
- For the fully rough flow regime (for example, for very large Reynolds numbers), the new formula and the Colebrook-White formula are identical.
- For the smooth flow regime (k = 0), the formula reduces to the transmission-factor law proposed by Zagarola,5 when f = 1 is chosen. This law is based on experiments in the range 3.2 less than or equal to 104 less than or equal Re less than or equal 3.5 x 10⁷, recently carried out at Princeton University ("super pipe experiment"). It is supposedly the best available law for this high Reynolds number regime.
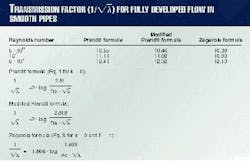
Table 1 gives the transmission factor of smooth pipes for various Reynolds numbers according to the two formulas used in the past and for the new formula. The latter leads to about 2% lower transmission factors, and the difference increases with higher Reynolds numbers.
It should be mentioned that the new formula with f = 1 reduces to the Zagarola formula not only in the case of smooth pipes but also for rough pipes at low Reynolds numbers.
The new formula for k = 0 can be derived from the Zagarola law by replacingThis factor is, therefore, the ratio of the transmission factors for f fi 1and f = 1 at the same Reynolds number (Equation 4).
The draught factor f describes additional losses in the smooth pipe (k = 0) due to deviations from the fully developed pipe flow (f =1). These are additional losses generated mainly by secondary flows due to pipe-axis curvature or other asymmetries in the pressure, temperature, and velocity fields in the pipe flow.
The draught factor f is closely related to the "pipeline efficiency" which is the same ratio as defined in Equation 4, taken at the same pressure drop, however, rather than at the same Reynolds number.
- The parameter n in Equation 3 has no relevance either in the smooth regime or in the fully rough regime. This parameter, however, plays an important role in the transition from smooth to fully rough flow.
For n = 1, the transition is very gentle, as described for instance by the Colebrook-White formula. On the other hand, the "point transition" mentioned before is well described by n = 10.6
Fig. 1 shows the different curves for n = 1 and n = 10.
- The concept of the new equation is very general. Setting the parameters in the equation according to the knowledge available covers all equations used today.
Therefore, the new equation has the potential to become widely accepted, giving a reliable theoretical foundation for pipeline planners and simulation tools. This would have important benefits for contractual negotiations in which issues concerning pipeline capacity are at stake.
Equation 3 is an implicit formula for the transmission factor (1/ square root of lw appears on both sides of the equation). However, this equation can be inverted to give the explicit formula shown in Equations 5a and 5b.The difference of the transmission factors resulting from Equations 3 and 5 is less than 0.2% for Reynolds numbers higher than 106. The accuracy of the explicit formula can be improved by taking into account further terms in the series expansion of the function E(Re) in Equation 5b.7
Additional losses
The transmission factor depends on the four dimensionless parameters: Re, f, k/D, and n (Equations 3 and 5). In the basic fully developed smooth pipe flow, the transmission factor depends only on the Reynolds number. The parameters f and k characterize additional energy losses.
As mentioned, the parameter f represents additional losses due to secondary flows (for example, pipe curvature) in a still smooth pipe according to Equation 4. It is a property of the flow.
On the other hand, k is a property of the pipe wall and represents additional losses that are independent of the viscosity and, hence, independent of the Reynolds number. The roughness k stands for the pressure drag, whereas f stands for the friction drag in the pipe.
The draught factor f can be determined only by in situ experiments, whereas the roughness k, as a property of the pipe wall, can be measured in smaller-scale experiments or indirectly by determining the geometric roughness, if the relation between hydraulic and geometric roughness is known.
Transition to fully rough flow
Under laboratory conditions, it is commonly reported that the natural roughness of commercial pipes leads to a gentle transition,8 whereas experiments on artificial sand-grain roughness show the more abrupt change of point transition.
The different behavior of the transition curves can be explained with the different roughness geometry and its relation to the thickness of the so-called viscous wall layer of the pipe flow.
The flow field in the pipe can be divided into two regions: the core region and the viscous wall layer close to the wall. Only in the latter region is the flow affected by viscosity.
Equation 6 gives the thickness of the wall layer.8
The thickness of the viscous wall layer decreases with increasing Reynolds number. At low Reynolds numbers, dw is fairly large and the roughness elements are buried in the wall layer. Hence, they have no effect on the friction: the wall is smooth in the hydraulic sense.With increasing Reynolds number, dw decreases, and the wall layer becomes partially filled with roughness elements, a part of which already protrude into the core region. This situation leads to a reduction of the transmission factor.When k > dw, the viscous layer disappears, and hence the Reynolds number has no influence on the friction. This corresponds to the fully rough flow type.
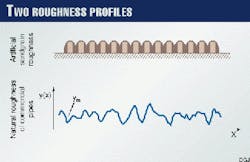
In Fig. 2, the different profiles of the artificial sand-grain roughness and of the natural roughness of commercial pipes are shown. It is plausible to infer from the diagrams that the transition from smooth to fully rough flow will be fairly abrupt in the first case, whereas the natural roughness of commercial pipes will lead to a very gentle transition.
Roughness profile
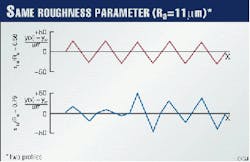
Fig. 3 shows the simplified roughness profiles of two different pipe walls. They have the same arithmetic mean roughness indicated in Equation 7.
They are expected to lead to a rather different transition behavior, however. To characterize the roughness profile, the roughness inhomogeneity parameter in Equation 8 has been defined.
The sRa/Ra value of roughness profile (a) in Fig. 3 is clearly smaller than that of profile (b).
How could the roughness profiles of the walls in the tests showing point transition be more homogeneous than those of commercial pipes? One possibility could be lining (epoxy coating) of the pipe.
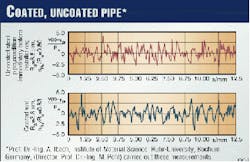
Fig. 4 shows two roughness profiles of the wall as they can be found in operational pipelines. The upper profile corresponds to an uncoated case; the lower, to a coated case.
Although the Ra values are quite different, the values sRa/Ra are practically the same. Lining is obviously not a possible explanation for the different transition behavior, all the more so as most of the tests showing point transition have been carried out with unlined pipelines.3
Liquid content
Several reports mention that small amounts of liquid (oil, condensates, water, glycol, etc.) were present in the pipeline.2 3 Therefore, the question arises whether liquid content in the pipeline can have a strong effect on the transition behavior and may eventually lead to point transition.
The following physical picture is suggested as a possible explanation for the point-transition behavior of pipeline flows:
- The liquid forms a thin annular film on the pipe wall with an averaged thickness d.
In this region, the liquid hold-up eL (volume fraction of liquid) and the ratio m.L/m.G of the mass flow rates of liquid (m.L) and of gas (m.G) start to increase with the Reynolds number such that the transmission factor stays constant.
Preliminary calculations of such two-phase annular flows have shown that very small amounts of liquid are sufficient to change the transition behavior described above (eL ≅ 10-4, m.L/m.G ≅ 10-6).
It is worth mentioning that the critical Reynolds number increases with decreasing film thickness after Jeffreys' theory. This is in accordance with the fact that all tests with lined pipes never reached the critical Reynolds number, obviously because the roughness and, hence, the film thickness are very small for lined pipes.3
If the physical picture just described were true, the roughness k in Equations 3 and 5, measured in an operational pipeline, would be a property of the liquid-film interface rather than of the pipe wall. In that case, a two-phase flow prediction method would be needed for gas pipelines having a point-transition behavior.
The implication of this result for the pipeline operating gas companies is that only in cases of absolutely dry gas pipelines can Equation 3 with n = 1 (which in this case gives results that are almost identical to the Colebrook-White equation) can be applied.
Care should be taken, however, if there is a possibility of any liquid in the pipeline because even very small amounts can have a strong effect in the transition region between smooth and rough pipe flow: that is, even if minute quantities of liquid are involved, the transmission-factor curve will be different from the curve n = 1 resulting from Equation 3.
Yet, the new equation with n > 1 covers these cases as well if the parameters appearing in the equation are known from test data.
In the future, an appropriate two-phase flow prediction method ought to be used. Particularly for very small liquid fractions, however, no such method is yet available.
Future research
To clarify the fluid dynamics in the transition region from smooth to fully rough flow in gas pipelines, experiments should be carried out in operational pipelines as well as in test facilities that enable the covering of the complete transition region.
The goal of this research should be to find out the effect of very small amounts of liquid in the gas flow on the transmission factor law and, in particular, on its transition behavior.
Acknowledgment
This work has been supported by GERG Research Project 1.19. GERG (Groupe Europeen de Recherches Gazieres), founded in 1961, consists of members from eight European countries.
References
- Colebrook, C.F., and White, C.M., "Experiments with fluid friction in roughened pipes," Proc. Royal Soc. London, Series A. Vol. 161, pp. 367-81 (1937).
- Smith, R.V., et al., "Flow of natural gas through experimental pipe lines and transmission lines," Monograph 9, US Bureau of Mines, 1954.
- Uhl, A.E., et al., "Steady flow in gas pipelines," AGA Technical Report No. 10 (1965).
- Dewerdt, F., and Asselin, A., "Étude experimentale et théorique des pertes de charge dans les canalisations de transport de gaz," Communication au congrès ATG de 1981.
- Zagarola, M.V., and Smits, A.J., "Mean-flow scaling of turbulent pipe flows," J. Fluid Mech., Vol. 373 (1998), pp. 33-79.
- Dewerdt, F., "La détermination des pertes de charge dans les canalizations," Gaz d'Aujourd'hui, Vol. 108 (1984), pp. 89-94.
- Schlichting, H., and Gersten, K., Boundary-Layer Theory. Eighth English edition, Springer Verlag, Berlin, Heidelberg, 1999.
- Benedict, R.P., Fundamentals of Pipe Flow, New York, John Wiley & Sons, 1980.
- Jeffreys, H., "On the formation of water waves by wind," Proc. Royal Soc., Vol. A 107 (1925), pp. 189-206 and Vol. A 110 (1926), pp. 241-47.
The Author
Klaus Gersten has been professor of fluid mechanics at the Ruhr-University, Bochum, Germany, since 1964. Between 1964 and 1992, he was director of the Institute of Thermo and Fluid Dynamics at the department of mechanical engineering.
Gersten received his diploma and doctoral degree from the Technical University of Braunschweig, Germany, and an honorary doctoral degree from the University of Essen, Germany. He is associate fellow of AIAA and member of the Austrian Academy of Sciences.
Heinz-Dieter Papenfuss has been professor of applied fluid mechanics at the faculty of mechanical engineering, Ruhr-University, Bochum, since 1986. He has a diploma in mechanical engineering and a doctoral degree from the Ruhr-University.
Between 1975 and 1978 Papenfuss was visiting assistant professor in the department of chemical engineering at the University of Arizona, Tucson.
Thomas Kurschat has worked as project manager in the R&D department of Ruhrgas AG, Essen, since 1994. He received a doctoral degree in physics from the University of Goettingen, Germany, in 1989.
Norman Revell has worked for BG Technology since 1974. He is a chartered mathematician and has a BSc in mathematical sciences from the University of Birmingham, UK.
Philippe Genillon received his diploma in engineering from the
Francisco Fernández Pérez has worked for Enagas, Madrid, since 1991, first as instrumentation engineer and, since 1992, as gas transportation optimization engineer. He holds a masters in electrical engineering from the University of Vigo, Spain.
