Remote sensing imagery analysis method lifts veil on pinnacle reefs in US basins
A new way of analyzing existing public aerial data pinpoints pinnacle reefs in four onshore producing basins in the US. Of the thousands of pinnacle reefs of the Hardeman/Fort Worth basin, Williston basin, Paradox basin, and Illinois basin, many have eluded existing prospecting tools including 3D seismic study. The author's proprietary AII Remote Sensing Imagery, by unveiling these pinnacle reefs, opens perhaps billions of barrels of onshore oil to development.
The predicament facing the US is a result of the maturing of its oil basins and limited frontier. The steady decrease in the size of the discoveries logged during the course of exploration of the North Sea basin is shown in Fig. 1. A similar evolution affects all basins because the strongest prospects are tackled first. Of course, the decline in the magnitude of the discoveries continues until ever-worsening economics halts exploration.
In the lower 48 states every mature onshore basin has been raked over repeatedly with all known prospecting tools. The wholesale application of Col. Drake's "drilling oilshows" approach must have removed all the pools given away by significant seeps from the population of remaining prospects. The enthusiastic use of Israel Charles White's theory of anticlinal accumulation of petroleum cannot have left a single, substantial, unexamined surface structure anywhere. Ditto for gravimetry, wireline logging and correlation, seismic with its various refinements, and no doubt various "black boxes."
The result is that most valid leads have been drilled. The prospects which remain in the mature basins are those that managed to evade existing exploration tools. Those prospects mostly consist of stratigraphic traps and pinnacle reefs whose individual reserves are 100,000 to 1,000,000 bbl. We have focused our efforts upon the pinnacle reefs. But just how many of these pinnacle reefs remain to be produced in the US?
Chappel reefs
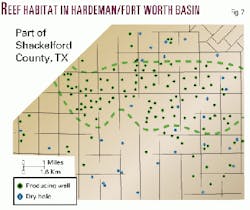
Consider just one of the four onshore areas where these pinnacle reefs have been productive, the Hardeman basin and Bend arch of the Fort Worth basin in north central Texas (Hardeman/Fort Worth basin). A remarkable part of that area in Shackelford County (Fig. 2) has tightly-packed Mississippian Chappel reef producers and a 93% success ratio which made the rather modest recovery of 52,000 bbl per producing well economic.
The operator of the "oilfield" attributed this event to the seismic which showed distinctive dim spots precisely above the individual reef cores, an accident which did not persist away from the charmed area and explains why the number of discoveries and the success ratio drop off precipitously in every direction. Of course, the acreage with the providential dim spots constitutes a sample which reveals the actual distribution of Chappel pinnacle reefs in the subsurface of the basin, a density which falls in the range of 7 to 12/sq mile.
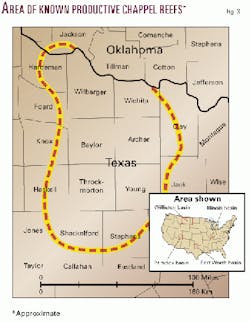
The approximate area of known productive Chappel pinnacle reefs (Fig. 3) covers about 10,000 sq miles. The undrilled Waulsortian reef basin is much larger. It outcrops in the Sacramento Mountains of New Mexico to the west, Oklahoma to the northeast, and San Saba to the south. Just the present productive area of the Hardeman/Fort Worth basin without extension, at a conservative density of significant pinnacles of 5/sq mile, hosts 50,000 pinnacles.
Much of this area also has multiple significant uphole potential zones that tend to drape over the deeper pinnacle reefs. If the buildups average only 100,000 bbl, which they should easily exceed, conservatively this area alone would add 5 billion bbl of new onshore sweet light crude oil not to mention natural gas.
Other reef basins
This may be the first time anyone suggested that more than 50,000 undrilled pinnacle reefs occur in the Hardeman/ Fort Worth basin, but the industry has already found hundreds of them and knows that many more must remain. Three other basins-Williston, Paradox, and Illinois (Fig. 3)-have large numbers of remaining pinnacle reefs. Why are not more of these pinnacles being drilled?
SPE Paper 18927 states that the recovery of the Hardeman basin producers will average about 170,000 bbl. This would be satisfactory in a development scenario, but the discouraging success rate of only 18% means that exploring in Hardeman is uneconomic and that its petroleum must remain inaccessible until a much better prospecting tool is developed.
This conclusion also applies to the Waulsortian reefs of the Lodgepole play of the Williston basin, where a nearly wholesale failure followed encouraging initial success (Dickenson field, 1993).
The reason for the failure was not because the geoscientists found the last of the pinnacle reefs. Rather it was because their prospecting tools, 2D and 3D seismic studies, were not up to the task. There are several reasons why present prospecting tools fail in the Hardeman/ Fort Worth basin and the other basins and cannot likely be upgraded.
Why existing tools fail
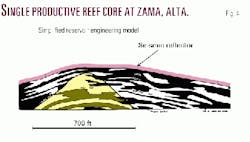
The first impediment to consistently hitting pinnacle reef cores with the bit is depicted on Fig. 4. The model, from Alberta's Zama area, portrays a productive reef core and the barren, tight sediments it sheds. As in the Hardeman/Fort Worth basin the seismic reflector hugs the envelope, not the reef core, with baleful consequences seeing that most of its pinnacles occur in clusters such as is shown on the collage (Fig. 5).
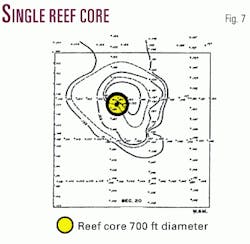
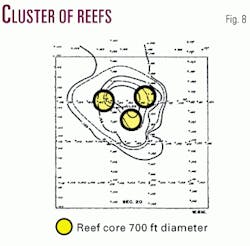
Fig. 6 shows a seismic structure in Zama. If the seismic anomaly hosts a single reef core, it is likely to be drilled successfully (Fig. 7), but if the anomaly is a cluster of several reefs (Fig. 8) a baffling dry hole is sure to result. Both the low velocity contrast between core and envelope and the constraints imposed by the Fresnel zone firmly preclude a seismic resolution of clusters of reef cores.
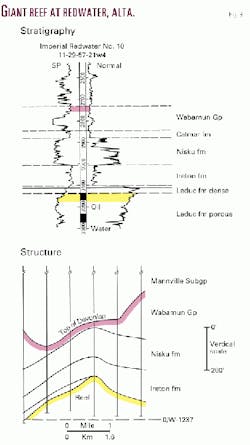
Secondly, a rarely acknowledged geological phenomenon disfigures seismic, often fatally. Fig. 9 shows the stratigraphy and the structure of the giant Redwater reef in Alberta. The well section demonstrates that the top of the Wabamun is concave due to the post-depositional solution of the underlying reef. In Redwater enough of the reef has been left standing to preserve a strong structural high, but this is not always the case elsewhere. This phenomenon can badly distort 2D and 3D seismic contouring in the Hardeman/ Fort Worth basin and explains why otherwise valid 3D Chester maps and isochrons fail to show many or most of the area's producing reefs.
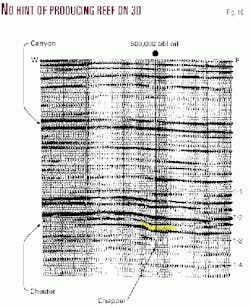
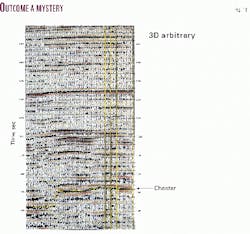
A 3D arbitrary (Fig. 10) across a producing pinnacle with a recovery in excess of 500,000 bbl of oil shows only a slight inflection (not a high) at the level of the Chester. This is due to the post-depositional solution which left a diminished and seismically invisible reef underneath; the high to the left of the well is barren. The Chester structure and the isochron do not even hint at the presence of this producing pinnacle reef.
Limitations with 3D
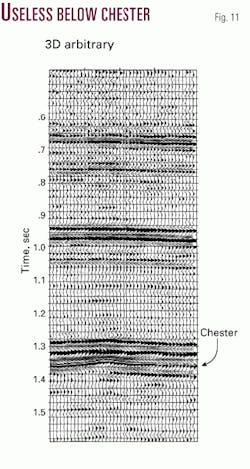
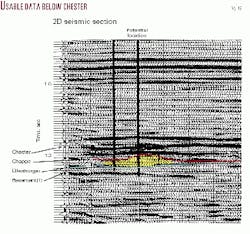
The third factor responsible for limited success in such prolific basins as the Hardeman or the Williston Waulsortian is the fact that 3D seismic, tripped as it is by reef clustering and solution, also shows very poor or no information at the level of the reefs. Figs. 11 and 12 present the same line as 2D section and 3D arbitrary. Typically the 3D seismic offers no usable information below the Chester while the 2D section does. Here the Chappel "reef" is in fact a cluster.
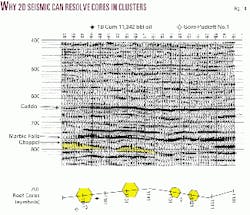
Fig. 13 shows a section from a 3D survey; one well is excellent, one amounts to a mere show, and the third is a dry hole. Seismic does not allow anyone to tell which is which, and this is the reason why all three were drilled. However, although 2D seismic is better than 3D at the pinnacle reef level, it still cannot resolve reef cores in clusters (Fig. 14).
Remote sensing imagery
Should we hope for further refinements of current prospecting tools to solve such problems? Not realistically, for they have evolved to the point where a tapering off of signal-to-noise ratio precludes major refinements.
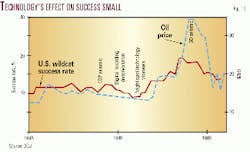
The history of American exploration success from 1945-90 does not suggest that "more of the same" can ever lift the success ratio of exploration into the necessary 90% range (Fig. 15). There is no doubt that the technology advances are improving recovery factors and economics, but the present tools are reaching their limits.
Only a new and wholly different prospecting tool could possibly achieve this. I have named this candidate prospecting tool AII, and it belongs to the family of analyses grouped under the label of remote sensing imagery.
AII remote sensing analysis uses aerial imagery. The data are publicly acquired and available from such sources as the US Geological Survey. When such data were used to find large anticlines the task was relatively easy, so all such anticlines have been drilled. The pinnacle reefs are not apparent and depend upon three nonobvious steps of analysis which call for a thorough understanding of geophysics, subsurface evidence, stratigraphy, and aerial geology and methodology.
Drilling program
AII remote sensing imagery pinpoints the position of the cores of Waulsortian pinnacle reefs in the subsurface and provides a fair indication of their size. It took nearly 20 years to develop and refine this prospecting tool and several million dollars to test it through the drilling phase.
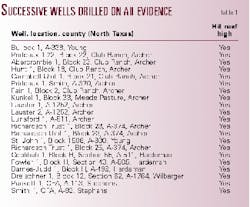
This work included the drilling of 21 consecutive wells sited by AII Remote Sensing Imagery in the Hardeman/Fort Worth basin (Table 1). Each bore hole hit its target reef "on the nose." Another well drilled in Illinois found its Salem buildup target, making the present tally 22-0. While not all were economic successes because of other learning curves, all proved that the reef was pinpointed and lessons learned.
Surely this new prospecting tool cannot be used in isolation; it must be used in conjunction with existing tools and knowledge. A "look down" analysis is inherently two-dimensional, so at least a single seismic line placed by AII Remote Sensing Imagery over the top of the pinnacle reef is necessary to assure sufficient height and volume of the reef. Log analysis of near wells may also provide important insight in areas such as the Hardeman basin.
Latest, first successes
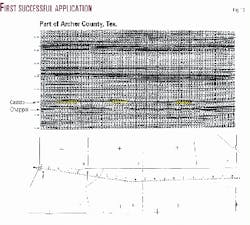
AII Remote Sensing Imagery's first successful application was in Archer County, Tex. (Fig. 16). This single seismic line, shot in 1991, was laid across the crests of three AII-located reef cores and had to be angled to make this possible. This was done without assistance from drilling or previous seismic.
The single seismic line confirmed the three reefs were exactly where predicted by AII and also confirmed that their height warranted drilling. The reefs were drilled and yielded three Chappel oil wells. The mediocre-quality processing reveals the Caddo highs but gives incoherent Chappel returns even though the line bisects the culminations of the buildups.
Our most-recent, much-better-pro- cessed 2D DMO migrated line in Stephens County, Tex. (Fig. 14) was angled to cross four AII-located Chappel reef cores (symbolically represented by hexagons). The two AII targets to the left gave good seismic Chappel highs (one with a toe well and 11,342 bbl oil recovery). The two reef cores to the right sit too close together to be resolved by seismic and create a "phantom" high which fooled a previous operator into drilling it.
The payoff
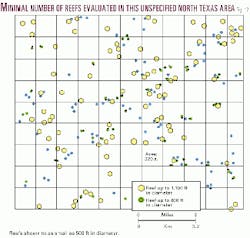
Fig. 17 shows all the significant reef cores mapped on the AII analysis in an area thought to be a mature basin. The yellow hexagons stand for the larger pinnacle reefs up to 1,100 ft in diameter; the circles for the lesser ones up to 800 ft in diameter; and the smaller pinnacle reefs of less than 500 ft in diameter have been omitted. Producing wells are highlighted in green, dry holes in blue.
The AII analysis demonstrates that despite dense drilling there has not been a single good hit on a substantial pinnacle reef; consequently the productivity of reefs and area must have been severely underestimated. What is really shocking, though, is that this apparently mature basin is in reality virtually a virgin basin with respect to reefs!
The paramount result is that AII remote sensing imagery not only unveils tens of thousands of pinnacle reef prospects but also turns exploratory drilling into development drilling by reducing the dry hole risk. This effect alters the economics and gives vigorous new life to the previously-written-off pinnacle reefs in these four onshore US basins.
AII remote sensing imagery has already mapped thousands of Waulsortian pinnacle reefs in the Hardeman/Fort Worth, Williston, Paradox, and Illinois basins. The elusive pinnacle reefs and their billions of barrels of sweet light crude oil can now be pinpointed. All that remains is for the operators in these four basins to proceed to develop the play in their new "frontiers."
The Author
The author of this article has been developing a method for mapping Waulsortian pinnacle reefs for the past 20 years.
The author Azad is solely responsible for working out the associated theory and application of the method, known as AII.
AII analysis is a way of interpreting aerial imagery available from the US Geological Survey and other sources. Applying AII to locate and evaluate pinnacle reefs involves a thorough understanding of geophysics, subsurface geology, stratigraphy, aerial geology, and methodology.
Known but overlooked geological processes make pinnacles mappable. The author says that the geological processes are demonstrable. Application requires three nonobvious steps.
It differs from the efforts of many other workers who tried to locate buried reefs using aerial imagery but ended up with "creekology" under the assumption that small buildups manifest their presence similarly to larger ones.
The method might be patentable but probably could not be protected.
The author researched the method for 10 years before the first well based on the learned principles was drilled.
Development involved clarifying the meaning of the seismic picture and solving a number of geological quandaries. These include direction and influence of paleocurrent, size and height of pinnacles, location of optimum porosity, and others.
It is possible to locate buried pinnacle reefs, show their size, and obtain a fair indication of height using solely the AII method. The deepest reefs mapped this way to date lie at about 9,000 ft in the Hardeman and Williston basins.
When AII information is combined with seismic data and geology, it is possible to determine that the reefs rise high enough in the section to contain hydrocarbons and the location of the porous side for drilling. This is critical, for in the Hardeman only pinnacles that rise to within 120 ft of the Chappel top carry appreciable hydrocarbons.
Azad notes that the study of outcrops in New Mexico and countless wireline logs in Texas has shown that Waulsortian mounds come in all sizes and occur at all stratigraphic levels. Some 50,000 pinnacles of sufficient size to contain substantial quantities of petroleum lie in a producing area centered on North Texas, he estimated.
AII analysis indicates that in the northern Rocky Mountains reefs extend several hundred miles west from Stark County, ND, where oil was discovered in Waulsortian mounds of Mississippian age in 1993.
The author believes AII to be advanced to the stage of making dry holes the exception but not so far that nothing more is left to learn. The technique is offered to upgrade leasehold, generate and sell prospects, license maps showing locations, and train and license the use of the analysis in geographic areas.
