PRODUCTION LOGGING-1: Friction affects fluid-density logs in high-rate wells
One needs downhole in situ monitoring to diagnose what and, even more importantly, where a problem lies in a producing well.
The well's behavior over its life cannot be managed by monitoring surface measurements alone.
Management of a well's performance not only includes the diagnosis of problems when the well does not perform to expectations, but also the optimization of flow to maximize the rate of return of the investment in the well.
A key element in reservoir modeling, in all but the simplest reservoirs, is the knowledge of the fluids flowing from each reservoir unit. But in wells producing at high flow rates, friction effects can render logs recorded with a differential-pressure density tool, by far the most common production-logging tool, virtually impossible to interpret.
This first in a series of three articles describes the basics of two-phase production log interpretation, illustrates the limitations of published friction corrections, and suggests ways to obtain better fluid-density logs at the wellsite.
With production logs from a UK North Sea oil field, the next two articles derive an empirical friction correction, highlight a shortcoming of third-party software, and provide an elegant nonlinear regression method that accurately corrects differential-pressure density logs for friction.
Need for production logging
Running production logs on a regular basis allows a petroleum engineer to diagnose production problems that arise during a well's life and to establish what fluids are being produced from each reservoir unit and in what quantities.
If an oil well's performance deteriorates because of either increasing water or gas production, one cannot diagnose the source of the problem or prepare possible remedial plans without a production-logging tool (PLT), although these effects can be seen at surface.
The PLT spinner measures total fluid flow rate at stations or depth levels in the well. If more than one phase is flowing in the well, as is usual, one needs an accurate downhole fluid density and some multiphase concepts to split out the two phases from the total fluid volume derived from the spinner response.
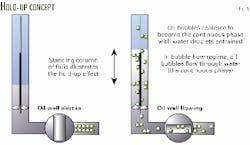
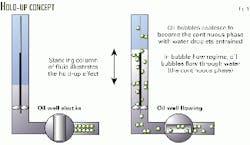
When a well is shut in, the PLT will see two distinct phases: a column of water over the perforations, represented by a simple one-way valve in Fig. 1, and an oil column above the water. But when the well is flowing, the bubble flow regime across the perforations indicates that the PLT will see a mixture of produced oil and water and some sump water.
A transition level exists where the oil bubbles coalesce and form a continuous phase that contains water droplets. Some of this water is produced to surface, while some will fall out of the mixture and be left downhole. This effect is known as "water holdup." One must remember that water holdup is not equal to water cut.
Water holdup
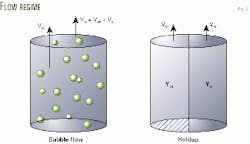
In two-phase flow, the lighter, less-dense phase will travel faster than the heavier, denser phase. The difference in velocity between the two phases is known as slip velocity,Vs, and this concept explains why water holdup is different to water cut. For example, Fig. 2 illustrates a two-phase bubble flow regime where, because of density differences, the oil bubbles are traveling faster than the water. Although the oil may occupy half of the pipe's cross-sectional area, for example when Yo = Yw, the oil production may be several times greater than the water production at any depth.
Yo and Yw comprise the fraction of the pipe in which oil and water are flowing, and Yw is referred to as the holdup.
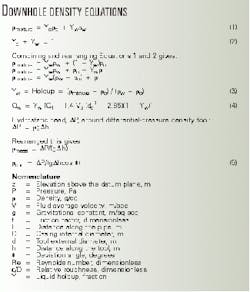
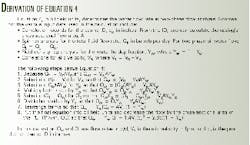
In two-phase flow at any depth, the fluid density measured by the PLT will consist of the oil and water in the pipe (Equations 1 and 2 in the equation box). Combining and rearranging these equations result in Equation 3, which estimates the holdup of the heavier phase, Yw.
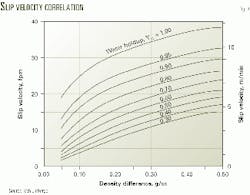
Once the holdup and the density difference between the two fluids is known, one can use published correlations, such as Fig. 3, to estimate the slip velocity between the light and heavy fluids.
With Equation 4, one calculates the volumetric flow rate of the heavier phase, for example the water fraction in a two-phase, oil-water system. Once water flow rate and total fluid rate are known, it is easy to back out the corresponding oil flow rate.
The accompanying box shows a detailed derivation of Equation 4.
Fluid-density measurements
If the fluid density of the mixture measured with a differential-pressure tool is affected by friction, the computed holdup will be too large. The estimated slip velocity and calculated water flow, therefore, will also be too large.
Of course, not all fluid-density measurements in a PLT string are the same. Some fluid-mixture density measurements are not affected at all by well deviation or friction effects. Tools with a bellows in a cage or strain gauges in pressure ports respond to friction from the flowing wellbore fluids as a pressure wave that causes apparent pressure drop to increase.
The sample chamber-type, fluid-density tools, however, have other drawbacks. By using a chamber, the tools have the inherent limitation of measuring only a small sample size. Also, in deviated wells, the chamber will tend to sample fluid from the lower side of the well and not the upper side.
Several different fluid-density measurement tools are in use today. These include the nuclear-density log, the capacitance log, and the differential-pressure log. Although these PLT sensors provide a friction-free measurement of fluid mixture density, they are not without their problems.
Some of these tools allow the wellbore fluid to enter a sample chamber or cavity within the body of the PLT. One type of nuclear-density tool bombards the fluid in the chamber with gamma rays from a chemical source at one end of the chamber.
The response of the detector at the other end of the sample chamber is inversely proportional to the fluid density, or in other words, lower detector counts indicate a more dense fluid in the chamber. But like all radioactive measurements, the gamma-ray tools have a statistically variable response and their sensitivity decreases in oil-water flow regimes.
Another nuclear-density tool radially measures gamma rays emitted into the surrounding well stream. But radial measurement nuclear tools have the problems of needing to be centralized and requiring knowledge of the casing ID for interpreting its response. These constraints are also inherent in many other PLT sensors.
A capacitance log measures fluid in a cavity between two plates and uses the fact that the dielectric constant of water is an order of magnitude greater than that of hydrocarbon. These tools, however, become insensitive in water holdups greater than 40%.
Friction susceptibility
The differential-pressure density tool is the most common PLT for measuring fluid density downhole. Unlike the sampling chamber-type tools, this tool requires well corrections for well deviation and friction effects. The correction for well deviation is trivial, but the correction for friction effects is more difficult.
All differential-pressure density tools calculate the average fluid density around the tool by assuming the pressure difference between two ports, set 2 ft apart, is due to only the hydrostatic head of the fluid around the tool.
If the well is deviated, then the vertical distance between the two pressure sensors will not be 2 ft. To correct for this inclination effect, one divides the raw fluid-density measurement by the cosine of the well deviation oslash;. This calculation, Equation 5, is usually done automatically at wellsite.
The friction correction, however, can be much greater than that for well deviation, especially in wells with high flow rates. Unfortunately, no published charts for this kind of tool are available that allow operating companies to correct for friction by themselves.
Friction effects
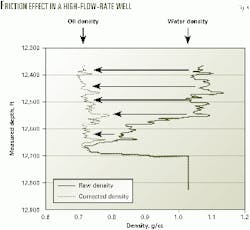
Friction effects can be substantial in wells with high flow rates, such as those in the North Sea (Fig. 4). The figure illustrates the effect of fluid-density logs in wells that produce at about 10,000 b/d through a 5-in. liner.
Fig. 4 shows that the shift in the density read by the tool can be more than 0.3 g/cc in these oil wells. This shift is almost the difference in density between 100% water and 100% oil. This is a real problem because it could suggest that a set of perforations is producing water instead of oil.
In extreme cases, an operator might plug oil-producing perforations because of a wrong interpretation.
Acquiring data
The basic procedure for running a production log is to lower the PLT string downhole on wireline or slickline. After passing through the tubing shoe and into the production casing or liner, the PLT is run across the perforated interval several times, both up and down, at different logging speeds, typically 30, 60, and 90 fpm.
The general procedure can involve shutting in the well, recording a log, and then opening the well again to record a log with the well flowing. The shut-in log obtains an in situ measurement of the different fluid densities as the various phases in the well segregate. The flowing log records the production profile in the well and provides the downhole volumetric flow rate.
The service companies can, but often do not, report all of the curves obtained from the logging passes. For quick-look interpretation at the wellsite, a standard practice is to use the "best" pass, which is usually the slowest down pass. Merged passes also are available usually at the wellsite for visual quality control.
For a final interpretation back at the office, service companies tend to use the cable speed corrected average of all the good passes. They report one fluid velocity, one pressure, one temperature, and one raw density. These values are derived from possibly six or more raw measurements. This averaging process is an integral part of the current interpretation methods in commercial production-logging interpretation packages.
Some service companies that run differential-pressure density tools take the raw measurements and interpolate between them to report a raw density. This density is the one that would be obtained by the tool under static conditions.
The importance of obtaining all data from each pass cannot be overstated. This will be explained in more detail in the third article in this series on production logging.
The problem for all interpretations in two-phase, high-rate wells is that there are limited published data to help correct the logs for friction. In fact, the published charts and equations for casing and tool friction are inappropriate for removing the friction effect observed in North Sea wells with high flow rates.
An idea for preventing excessive friction effects on fluid-density logs recorded with differential pressure tool is to reduce the flow past the tool. One can do this simply by choking back the well during logging.
Choking back wells
Friction effects on the response of a differential-pressure tool basically are due to a well flowing at a very high rate. With low flow rates, there is no need to correct for friction effects because the tool will indicate the actual mixture density. To log high-rate wells without needing excessive friction corrections, therefore, one has to choke back the well to a more suitable flow rate.
The dynamic range of interest for the differential pressure tool in an oil well is around 0.3 g/cc, for example 0.7 g/cc (100% oil) to 1.04 g/cc (100% water).
If the friction effect is to be less than 5% of the dynamic range, one must set the maximum shift that can be applied to the raw density to about 0.01 g/cc. In this way, a critical downhole rate is defined as the flow rate that would give a maximum 0.01-g/cc difference between the measured and real density.
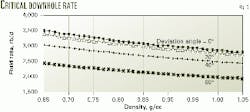
The expression for the change in density, Dp, due to friction is a complex one and it has to be evaluated for each well's configuration.Fig. 5 shows the critical downhole rate for the completion type used in a field study. This well is near vertical with a 5 in., 23.2 lb/ft tubing, and relative 0.0006 pipe roughness that is assumed to be constant.
This figure indicates that a vertical well completed in this field is producing 100% oil with a 0.7-g/cc downhole density. The critical downhole rate in reservoir barrels (rb), therefore, will be about 3,400 b/d. The produced oil, however, is metered at surface conditions, so that one needs to change this rate to stock-tank barrels (stb). The division of the 3,400 rb/day downhole rate by the oil formation volume factor results in a 2,500 stb/day equivalent rate.
Fig. 5 also highlights the significant effect of well deviation on the critical downhole rate as a well's inclination increases above 20°.
Of course, this method only can be applied to density logs that have not yet been run. If the logs already have been obtained and were affected by friction, one needs to apply a correction factor.
In some multilayered reservoirs, choking back the well may alter the inflow performance of individual layers and change the flow regime in the wellbore itself. If, however, there is little cross-flow between layers when the well is shut-in, choking back the well to reduce friction effects is valid.
Articles 2 and 3 of this series will cover ways for extracting meaningful fluid mixture density from differential pressure logs that are affected significantly by friction.
The authors
Miguel Jakymec is a reservoir engineer for Petroleos de Venezuela SA (PDVSA), Caracas. He undertook research into friction effects on production logs in high-rate wells on behalf of Enterprise Oil while studying at the Imperial College, London. Jakymec has a chemical engineering degree from Zulia University, Venezuela, and an MS in petroleum engineering from Imperial College.
X.D. Jing is reader in petroleum engineering at the center for petroleum studies, T.H. Huxley school of environment, earth sciences and engineering at Imperial College, London. He supervises research in the petrophysics and reservoir physics research laboratories and teaches petrophysics and gas reservoir engineering. Previously, he worked for Core Laboratories Inc. and at the Shell International Research Center.
Bob Harrison is a senior-staff petroleum engineer with Enterprise Oil plc, London. He previoulsy worked with several companies in seismic acquisition, well logging, and petroleum engineering, as well as teaching economics and production logging at Imperial College.
Harrison has a BS in electrical engineering from the University of Science & Technology in Manchester, an MS in petroleum engineering from Imperial College, and an executive MBA from Cranfield School of Management.
