Integrated reconnaissance model scores on Midland basin eastern shelf
As oil and gas profit margins continue to be unpredictable and volatile, proper screening and evaluation of prospects will become even more essential. Integrating geological, geomorphic, and direct geochemical reconnaissance data is a very cost effective, pragmatic approach to evaluating oil and gas prospects.
This integrated modeling approach offers numerous advantages in both time and costs by:
- Eliminating less prospective areas in the early stages of project development.
- Promoting cost savings in lease and legal expenses by defining areas with the highest probability for success.
- Reducing surface damages associated with more intrusive exploration tools such as seismic and some high-resolution geochemical techniques.
- Allowing quick evaluation of large areas for prospect potential at a low cost.
- Allowing the explorationist to reduce costs by managing and conducting some operations of the reconnaissance program.1
A Tannehill prospect along the Midland basin eastern shelf in Dickens County, Tex., illustrates these modeling concepts.
It involved integrating geological, geomorphic, and direct geochemical reconnaissance data to cost-effectively evaluate a 4,000-ft oil prospect.
The basic concepts of the Tannehill reconnaissance model to be outlined below can be implemented for other geological plays. These modeling concepts apply to the reconnaissance and detailed exploration project phases.
These concepts have been used successfully to discover and develop Tannehill oil fields such as Navigator field, Christopher field, and INS field.2 3 Combined, these fields will yield several million barrels of oil.
Building the geological model
Step one: The first modeling step involves development of an accurate geological model. Isopach and structure maps are constructed based on available well log information and seismic survey data. The isopach map is later integrated with the light gas or low-molecular-weight hydrocarbon data. Integration will indicate the more prospective areas of the prospect.
In constructing the structure map, special attention is given areas capable of generating macrofractures, such as faults and joints.4 Areas believed to contain macrofractures will be compared to the anomalous polynuclear aromatic compounds (PAC) data.5 6
Step two: The second modeling step involves mapping the geomorphology. Particular attention is given surface drainage patterns and geomorphic highs.
Drainage patterns may reflect the surface location of faults and joints. Also, geomorphic highs may indicate subsurface structural highs. Therefore, the direct geochemical reconnaissance sampling program should be designed to evaluate these geomorphic features.
Direct geochem recon data
null
Thermogenic hydrocarbons
Thermogenic hydrocarbons migrate from the petroleum reservoir.7 Direct geochemical reconnaissance data detect and measure these vertically migrating hydrocarbons in near-surface soils associated with microseepage (small fractures) and macroseepage (large fractures).
Direct geochemical data include:
1. Interstitial soil gas analysis for light gas or low-molecular-weight pore space hydrocarbons,
2. Acid extraction analysis for adsorbed, or occluded, low-molecular-weight hydrocarbons, and
3. Fluorescence analysis for heavier PAC hydrocarbons.
Mechanics of mass transport
Understanding the mechanics of mass transport, or how each hydrocarbon suite migrates from the reservoir formation to the surface, is essential for integrating the direct geochemical data with the geological model.8 9
Anomalous light gas data can indicate both microfracture and macrofracture migration pathways of fractionated low-molecular-weight hydrocarbons from the reservoir formation. Heavier PAC hydrocarbons require larger conduits. Therefore anomalous, or elevated, PAC data concentrations indicate the location of macro fractures.10
Geological, direct geochem data
null
Modeling correlations
Modeling requires understanding the correlation between the subsurface geology, geomorphology, and direct geochemical data.
All data sets should be mapped on the same scale. The direct geochemical data should be displayed on transparent film. This provides easy comparison to subsurface geology and geomorphic data. The explorationist begins the integrated modeling process by answering the following questions:
- What is the correlation between the anomalous geochemical data and the respective depositional environment, structure and isopach maps, migration pathways, and reservoir information, e.g. oil or gas?
- Do the anomalous PAC data indicate the location of macrofractures, such as faults or joints, generated by structural forces?
- Is there a correlation between the geomorphology, e.g. drainage patterns, and anomalous PAC data?
- Do the anomalous light gas data patterns correlate to the prospective reservoir formation as outlined by the isopach map?
- Do the geochemical data sets validate, condemn, or alter the concepts developed in the geological model?
The subsurface geology, geomorphology, and geochemistry are modeled in a concerted synergistic process and not as autonomous data sets. The geochemical data interpretation must make relevant reservoir and geological sense.
Tannehill reconnaissance model
null
Geological model
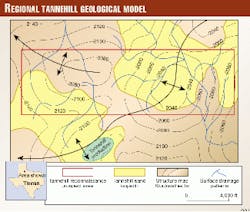
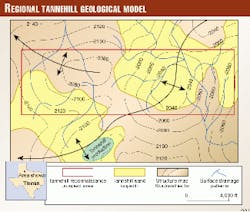
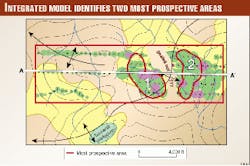
A geological model was developed for a Lower Permian Tannehill pros- pect in Dickens County, Tex. Based on well log information and geomorphology, the geological model in Fig. 1 was constructed illustrating:
- A reconnaissance area covering about 5 sq miles.
- A structure map for the base of the Stockwether lime. The map shows a large structural feature plunging southwest and a smaller feature plunging northwest.
- An isopach map of the Tannehill sand. These prolific, fluvial-deltaic sands were deposited during alternate transgressive and regressive cycles along the eastern shelf of the Midland basin. The isopach was made from limited well control information and extensive regional experience.
- Significant drainage patterns were noted in the geomorphology. Past regional experience indicates these features usually reflect larger, subsurface fractures from differential forces.
Direct data
A direct, geochemical reconnaissance program was designed to evaluate the hydrocarbon potential of the geological model. Near-surface soil samples were collected along three east-west lines. Two direct, geochemical analyses were selected: acid extraction and fluorescence.
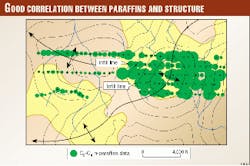
Acid extraction analysis provided a light gas (C2-C4 n-paraffin) hydrocarbon evaluation to determine the more prospective Tannehill sand areas. The isopach map predicted significant Tannehill sand in the central area of the southwest plunging structure.
Fig. 2 shows good correlation between anomalous C2-C4 n-paraffin data and Tannehill sand in this area. The isopach predicted that Tannehill sand along the southern flank, approaching the crest of the northwest plunging structure, is thinning or shaled-out. This geological interpretation is validated by decreased C2-C4 n-paraffin data. Therefore, the C2-C4 n-paraffin data indicate the more prospective Tannehill sand area is near the central area of the southwest plunging structure.
Fluorescence analysis measures the heavier PAC (2-ring aromatic) hydrocarbons migrating along larger conduits or macrofractures.
Past experience with Tannehill prospects suggests macrofractures are probably due to differential forces. These larger fractures usually develop along structural flanks and lithofacies boundaries, many times correlating to surface drainage patterns.
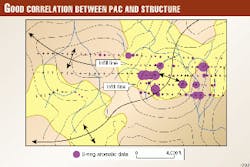
Since anomalous 2-ring PAC data detect these larger conduits, the spatial extent of the data is more restricted. Fig. 3 displays the 2-ring PAC data.
Anomalous PAC data are near the structural flanks of the central portion of the southwest plunging structure. Larger fractures, associated with the northwest structure, are void of anomalous PAC data. Therefore, PAC data also indicate the central area of the southwest plunging structure is more prospective.11
Quality control measures
null
Data reproducibility
The ability to reproduce direct geochemical data over time is paramount if the project is to be extended, infilled, or specific areas detailed in a later phase. Therefore, geochemical data variability must be known.
If the data cannot be adequately reproduced over time, it is impossible to tie future data to existing data. The ability to determine anomalous hydrocarbon features, from these combined non-reproducible geochemical data sets, will not yield statistically credible information for integrating with the geological model for decision making.12
The ability to provide reliable, high-quality data requires the application of quality control measures reflective of an ANSI/ASQC Q90s Standard Series and ISO 9000s Quality System. For reliable geochemical data this would include implementation of quality procedures such as:
- Statistical quality control charts to monitor instrumentation stability and operator technique.
- Juran approach studies that determine the variability of geochemical data.
- Statistical correlation analysis using correlation coefficients13 and hydrocarbon cross plots that indicate project data quality.14
- Inspection and testing through certified calibration standards.
- Ongoing quality training for both management and employees based on the quality philosophies of Deming, Juran, and Crosby.
- Specific procedures for troubleshooting problems and nonconforming situations.15
Two months after the initial reconnaissance survey, two infill lines were conducted over the central portion of the southwest plunging structure (Figs. 2, 3). The infill data validate the anomalous data trends of the original survey. Conforming to elements of a well managed and implemented quality system insures high-quality data necessary to tie multiple data sets collected over time.
Model assessments
Following assessments were made based on the Tannehill reconnaissance model illustrated in Fig. 4:
- Anomalous C2-C4 n-paraffin data correlated with the Tannehill sand isopach indicate the central portion of the southwest plunging structure is more prospective.
- In this more prospective area, C2-C4 n-paraffin data show an area of attenuated or lower concentrations. This area trends northwest-southeast across the interpreted crest of the southwest plunging structure. This may indicate Tannehill sand has thinned or shaled-out. Therefore the possibility exists for two detached sand bodies. The two areas are labeled "1" and "2" in Fig. 4.
- Elevated 2-ring PAC data also validated that the central area of the southwest plunging structure is more prospective. Good correlation between geomorphic drainage patterns and anomalous PAC data indicates macroseepage along larger fractures.
- Subsurface maps were constructed on limited well control information. However, attenuated geochemical data in both data sets validate the isopach interpretation of no reservoir quality Tannehill sand over the northwest-plunging structure.
- The original Tannehill reconnaissance prospect covered approximately 5 sq miles. Model assessments concluded that about 2 sq miles, or 40%, of the original prospect are prospective.
- The costs for dual geochemical analyses were $5,772, or $1,154/sq mile, when the explorationist manages and conducts the reconnaissance program and delivers the soil samples to the laboratory for analysis.
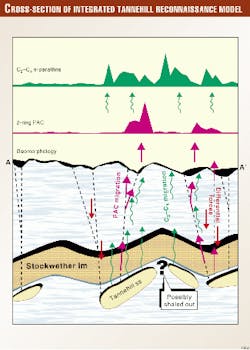
- Fig 5 is a vertical profile of the Tannehill reconnaissance model constructed along line A-A' in Fig. 4. The vertical profile shows the correlation between: 1) migration pathways and the two geochemical data sets, 2) structural subsurface geology, 3) Tannehill sands, and 4) geomorphology.
Model recommendations
Based on model assessments, the following would be considered before selecting drilling locations.
Additional information is needed to accurately determine the location and structural profile of the southwest plunging feature. A 3D seismic survey covering the smaller, more prospective central portion of the southwest plunging feature is necessary. Seismic survey data may indicate two smaller structural features near "1" and "2" (Fig. 4), as opposed to one larger feature.
Anomalous C2-C4 n-paraffin data indicate possibly two separate sand bodies. A close-spaced, or detailed, high-resolution light gas geochemical survey is needed across areas "1" and "2" (Fig. 4). Detailed geochemical data help determine shaled-out sequences, delineate reservoir formation edges, spatial extent and trend (geometry), plus compositional changes.16 17
Only after the subsurface geology, 3D seismic survey data, and detailed, high-resolution geochemical data are evaluated, and the model refined, would a drilling location be selected.18 19
Acknowledgements
The senior author is grateful to J. Michael Usseglio, president of JM Usseglio Consulting Group, for providing the geochemical data and geological interpretation for the Tannehill reconnaissance model. Also, special thanks to Robert A. Cannon, 1998-99 president, Dallas Geological Society, for his comments, suggestions, and information over the years in helping develop and test the concepts of the integrated Tannehill geological model at the reconnaissance and detailed phases.
References
- Belt, John Q. Jr., and Rice, Gary K., "Macro exploration modeling: A pragmatic, multidisciplinary team process," OGJ, June 5, 1995, pp. 43-45.
- Cannon, Robert A., "Navigator field, Dickens County, Texas-A case of integration," extended abs. in proceedings, 1999 Southwest Section AAPG convention, Abilene, Tex.
- Cannon, Robert A., "Navigator field, Dickens County, Texas-A case of integration," abs. in proceedings, 1999 AAPG annual convention, San Antonio.
- Billings, Marland P., "Structural geology," chapters related to the mechanics of faulting and joints, Prentice-Hall, Inc., Englewood Cliffs, N.J., 1952.
- Belt, John Q. Jr., and Rice, Gary K., "Offshore 3D seismic, geochemical data integration, main pass project, Gulf of Mexico," OGJ, Apr. 1, 1996, pp. 76-81.
- Belt, John Q. Jr., and Rice, Gary K., "Advantages seen in integrated offshore 3D seismic, geochem data," OGJ, Apr. 8, 1996, pp. 100-102.
- Hunt, John M., "Petroleum geochemistry and geology," Chapter 3-Petroleum and its products," W.H. Freeman and Co., San Francisco, Calif., 1979, pp. 28-66.
- Arp, Gerald K., "Effusive microseepage: A first approximation model for light hydrocarbon movement in the subsurface," APGE Bull. 8, December 1992, pp. 1-17.
- Klusman, Ronald W., and Saaed, Mahyoug A., "Comparison of light hydrocarbon microseepage mechanisms," in Schumacher, Dietmar, and Abrams, Michael A., eds., "Hydrocarbon migration and its near-surface expression," AAPG Memoir 66, 1996, pp. 157-168.
- Belt, John Q. Jr., and Rice, Gary K., "Quantifying polynuclear aromatic compounds helps locate major structural fractures for prospect evaluation," abs. 1998 AAPG annual convention, Salt Lake City.
- Belt, John Q. Jr., and Rice, Gary K., "Low-cost quantified fluorescence analysis of soils helps evaluate the hydrocarbon potential of oil & gas prospects," abs. 1999 AAPG Southwest Section convention, Abilene, Tex.
- Belt, John Q. Jr., and Rice, Gary K., "Applications of statistical quality control measures to surface geochemical exploration data," 1999 AAPG annual convention, San Antonio.
- SAS Institute Inc., "SAS user's guide, basics," Version 5 Edition, Cary, N.C., 1985, 1,290 p.
- Brightman, Harvey J., "Statistics in plain English," Chapter 6, Regression analysis, Duxbury Press-Wadworth Publishing Co., Belmont, Calif., 1989, pp. 225-265.
- Chase, Richard B., Aquilano, Nicholas J., and Jacobs, F. Robert, "Production and operations management: manufacturing and services," Chapter 6: Quality management, Irwin and McGraw-Hill Publishing Co., New York, 1998, pp. 198-259.
- Rice, Gary K., and Jackson, Vernon N., "Geochemical techniques in exploration," 1984 ASP-ACSM fall convention, San Antonio, technical papers, pp. 543-558.
- Rice, Gary K., Belt, John Q. Jr., Howell, Harvey H., Harweth, Lance, and Bowerman, Chad A., "Using soil gas composition to distinguish hydrocarbon type in areas of multiple petroleum-producing horizons," abs. 1997 AAPG annual convention, Dallas.
- Rice, Gary K., "Exploration enhancement by integrating near-surface geochemical and seismic methods," OGJ, Apr. 3, 1989, pp. 66-71.
- Rice, Gary K., and Belt, John Q. Jr., "Dynamics of surface hydrocarbon gas patterns during oil production," abs. 1995 AAPG annual convention, Houston.
The Authors
John Q. Belt Jr. is vice-president of GeoFrontiers Corp., Dallas, formerly the Geochemical Exploration Group of Halliburton Geophysical Services Inc. He has more than 25 years of experience managing petrochemical and geochemical exploration laboratories and served in various quality control positions with ARCO Chemical Co., Halliburton Geophysical Services, and GeoFrontiers. He has bachelor's or master's degrees in geology, international business, and human relations and business. E-mail: [email protected]
Gary K. Rice is president of GeoFrontiers Corp., Dallas, which develops and provides geochemical solutions for exploration and production. He has managed geochemical technologies spanning nearly 25 years in Texas Instruments (GSI), Halliburton Geophysical Services, and GeoFrontiers. He has BS and PhD degrees in chemistry from Oklahoma State University.
