Shale gas changes N. American gas production projections
Estimates of ultimate gas recovery from shales have changed the outlook for gas production in the US and Canada.
This article revises our 2007 gas production projections1 by incorporating various estimates of ultimate gas recovery from References 2-8.
The revised projections used a modeling approach as discussed in Mohr9 to generate low, best-guess, and high cases for conventional, tight, shale, and coalbed methane resources for both Canada and the US.
Conventional gas
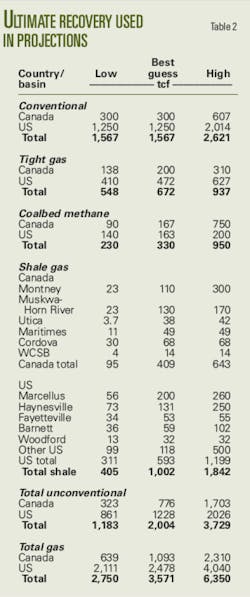
For Canada, the analysis increased the low-case ultimate recovery to 300 tcf from 250 tcf10 as a consequence of applying the Hubbert linearization technique to production for years 1995-2006.
The best-guess case assumed the same ultimate recovery as the low case.
The high-case estimate of 607 tcf was from a recent report by the German Federal Institute for Geosciences and Natural Resources (BGR).11
For the US, the low case remained unchanged at 1,250 tcf.10 The best case also assumed this value.
The high-case value of 2,014 tcf was again from BGR.11
Tight gas
For Canada tight gas, the 138-tcf low and 310-tcf high ultimate conventional gas recovery estimates were the same as in Dawson.7 Dawson called Montney gas tight rather than shale gas, while this article considers Montney as shale and hence removed Montney's marketable gas from the tight gas estimate.
The best-guess estimate was 200 tcf, a value halfway between the low and high estimates.
The low case for the US assumed a 310-tcf remaining conventional gas recovery as shown on a web site maintained by the US Natural Gas Supply Association.12 When combined with ~100 tcf of cumulative production, the low-case ultimate recovery was 410 tcf.
The high case for the US assumed 627-tcf13 and the best-guess case assumed 472-tcf.14
Coalbed methane
For Canada, the ultimate recoveries used in the analysis for coalbed methane were 90-tcf low case,8 167-tcf best guess,15 and 750-tcf high case based on Campbell and Heaps16 estimated 3,000 tcf of resources and a recovery factor of 25%.
Coalbed methane recovery factors typically range from 20 to 33%.15 17 18
For the US, the low case assumed 140-tcf ultimate coalbed methane recovery,3 which is similar to our 2007 estimate of 150 tcf.
The high case assumed a 200-tcf ultimate recovery based on probable and speculative resources of 163 tcf19 and historic production and proved reserves of ~37 tcf.
The best-guess case assumed a 163-tcf ultimate recovery, which is similar to our 2007 estimate.
Shale gas
Table 1 lists the shale gas recoverable resources by basin from various literature sources.3 5-8 20
For Canada, the low-case values were from Theal5 for Montney, Horn River, and Utica and Dawson7 low values for Cordova and Western Canada Sedimentary Basin (WCSB).
The best-guess values were from Kuuskraa and Stevens3 for Montney and Horn River, Theal risked for Utica, and Dawson high values for Maritimes, Cordova, and WCSB.
The high case assumed Dawson high values for all Canadian basins.
For the US, the low case used values from Theal unrisked estimates for the five key US basins (Marcellus, Haynesville, Fayetteville, Barnett, and Woodford) with a slight addition to Barnett for cumulative production, and 99 tcf for other basins based on Henning,8 US Federal Energy Regulatory Commission,20 and Theal unrisked numbers.
The best guess used Kuuskraa and Stevens values for the five key US basins and FERC, Henning, and Theal risked numbers for the rest of the US.
The high-case values were from Skipper6 for Marcellus and Haynesville, Theal risked numbers for Fayetteville, FERC values for the Barnett (with a slight addition for cumulative production), Kuuskraa and Stevens for Woodford, and Skipper for the rest of the US.
Table 2 summarizes the values selected.
Production
Recent production statistics were from the Canadian Association of Petroleum Producers,21 and US Energy Information Administration,22 as well as Henning, Kuuskraa,14 Kuuskraa and Stevens, and Vandenborn.23
Additional historic data were from Mitchell.24
Results
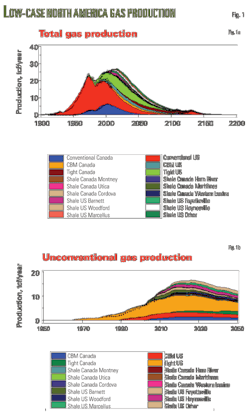
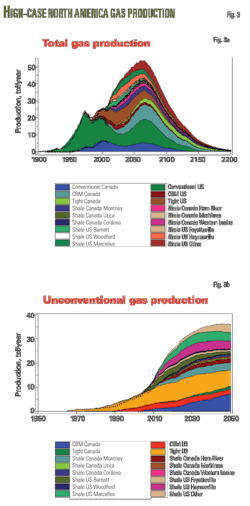
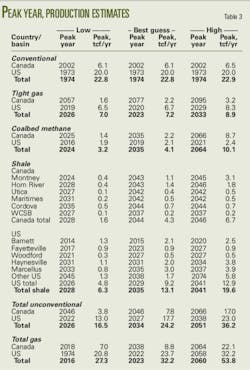
Figs. 1-3 show the projected production for the three cases and Table 3 lists the peak production and year.
With these new data, projections for North America indicate a 27 tcf/year peak in 2016 for the low case and a 54 tcf/year peak in 2060 for the high case. The best-guess estimate has a 32 tcf/year peak in 2023.
This peak is higher than in our 2007 estimate that found gas production already peaking in 2001 at 26 tcf/year. The revised projections are due largely to the higher ultimate recovery estimates and production from shale gas.
All cases for Canada indicate that conventional gas production peaked in 2002. In the low case, coalbed methane and shale gas production delay the total gas production peak to 2018 at 7 tcf/year. The best-guess case sees shale production and a small contribution by coalbed methane and tight gas delaying the total gas production peak to 2038 at 9 tcf/year.
In the high case, coalbed methane and shale gas along with a second cycle of conventional gas cause total gas production to peak in 2064 at 22 tcf/year.
For the US, all cases show that conventional gas production peaked in 1973. In the low case, unconventional gas production does not mitigate fully the conventional gas peak, with total gas production peaking in 1974 at 20.8 tcf/year. Production, however, does remain high until about 2020 before steadily declining.
In the best-guest case, shale gas production causes total gas production to increase rapidly from 2005 until total natural gas production peaks in 2022 at 23.7 tcf/year.
For the high case, both shale gas and a second cycle of conventional gas cause total natural gas to peak in 2058 at 32.2 tcf/year.
Theal and Kuuskraa and Stevens indicated shale gas production will reach ~9 tcf/year in 2018. In comparison, the 2018 shale gas production in our study is 6 tcf/year in the low case and 12.5 tcf/year in the high case.
Our best-guess, which was based partially on Kuuskraa and Stevens estimates, projects production at 10 tcf/year in 2018.
Kuuskraa and Stevens project that North American unconventional gas production will reach 19.3 tcf/year in 2020. Our projections for 2020 are an unconventional production of 16 tcf/year in the low case, 25.7 tcf/year in the high case, and 21.5 tcf/year in the best-guess case.
Shale gas and unconventional gas projections are reasonably similar to current literature projections.
The high case shows conventional natural gas production for both Canada and the US having a second production cycle; however, is this second cycle likely?
The high case assumed the conventional natural gas ultimate recovery values from BGR. BGR estimated the ultimate recovery by summing cumulative production, reserves, and resources to obtain it ultimate recovery estimates.
In the case of the US, BGR appears to include unconventional production in the cumulative production assessment. Also the BGR conventional gas reserves estimate appears to be the same as the EIA value for all (conventional + unconventional) gas.
The BGR resource estimate for the US is from the 2008 USGS Circum-Arctic Resources Appraisal (personal communication with Hilmar Rempel), which is a conventional gas estimate.
It may be that BGR's conventional ultimate recovery is the same as the total gas.
Indeed the conventional ultimate recovery from BGR for the US is similar to the low ultimate recovery estimate for all natural gas in the US.
Because of the questions surrounding the BGR estimate of conventional ultimate recovery, we modeled the high case a second time, with the conventional gas production changed to the best-guess case.
In that scenario, total gas production peaks at 40.6 tcf/year in 2038 (Fig. 4), and this projection is probably a more realistic high-case scenario.
In summary, it is apparent that gas production in North America will not peak until at least 2016 and probably much longer due to advancements in shale gas technology and production.
There are always difficulties in attempting to predict future gas production as ultimate recoveries are reevaluated because of new discoveries, technical developments, and geological assessments.
In particular, Canadian tight gas is difficult to model because the Canadian data do not differentiate between tight and conventional gas.
Coalbed methane and shale gas production are in the early stages of production in North America and large deviations from current projections may occur.
Acknowledgments
The authors thank Keith Skipper for his comments and feedback, as well as Gary Long from the EIA and Hilmer Rempel from BGR for their assistance.
References
1. Mohr, S.H., and Evans, G.M., "Models provide insight on North American gas future," OGJ, July 2, 2007, p. 51.
2. "Study analyzes nine US, Canada shale gas plays," OGJ, Nov. 10, 2008, p. 45.
3. Kuuskraa, V.A., and Stevens, S.H., Worldwide gas shales and unconventional gas: A status report, UN Climate Change Conference COP15, Copenhagen, Dec. 7-18, 2009.
4. Cohen, D., "A Shale Gas Boom?" ASPO USA, June 25, 2009, from www.aspousa.org/index.php/2009/06/a-shale-gas-boom/, May 26, 2010.
5. Theal, C., "The Shale Gas Revolution: The Bear Market Balancing Act. May 20, 2009, from https://research.tristonecapital.com/CSUG_AGM_20May09.pdf, May 26, 2010.
6. Skipper, K., "Status of global shale gas developments, with particular emphasis on North America," IRR's Inaugural Shale Gas Briefing, Brisbane, Mar. 30, 2010.
7. Dawson, F.M., "Cross Canada Check Up Unconventional Gas Emerging Opportunities and Status of Activity," CSUG Technical Luncheon, Calgary, May 12, 2010. from www.csug.ca/images/Technical_Luncheons/Presentations/2010/MDawson_AGM2010.pdf, May 5, 2010.
8. Henning, S., "Shale Gas Resources and Development," IRR's Inaugural Shale Gas Briefing, Brisbane, Mar. 30, 2010.
9. Mohr, S.H., Projection of World fossil fuel production with supply and demand interactions, PhD thesis submitted to the University of Newcastle, February 2010.
10. Laherrere, J., "Natural gas future supply," June 22-24, 2004, from www.oilcrisis.com/laherrere/IIASA2004.pdf, June 6, 2007.
11. Rempel, H., Schmidt, S., and Schwarz-Schampera, U., Reserves, Resources and Availability of Energy Resources, BGR Annual Report, 2009, from www.bgr.bund.de, June 1, 2010.
12. Unconventional Natural Gas Resources, from NaturalGas.org website http://www.naturalgas.org/overview/unconvent_ng_resource.asp, May 26, 2010.
13. Pike, B., "Energy supply: The role of natural gas. Commercializing Methane Hydrates," Hart Energy Conference, Houston, Dec. 5-6, 2006, from http://hartenergyconferences.com/hydratemethane06/BPike.pdf, Aug. 18, 2009.
14. Kuuskraa, V.A., "Reserves, production grew greatly during last decade," OGJ, Sept. 3, 2007, pp. 35-39.
15. Stringham, G., Canadian natural gas outlook. Technical report, Canadian Association of Petroleum Producers, Calgary, from www.capp.ca/raw.asp?x=1&dt=PDF&dn=110467, May, 21, 2007.
16. Campbell, C.J., and Heaps, S., An Atlas of Oil and Gas Depletion. 2nd edition, Jeremy Mills Publishing Ltd., Huddersfield, UK, 2009.
17. Coal seam methane in NSW. N.S.W. Department of Primary Industries, 2005 from www.dpi.nsw.gov.au/minerals/geological/overview/regional/sedimentary-basins/methanensw, May 4, 2007.
18. Soot, P.M., "Method forecasts coalbed methane production," OGJ, Oct. 28, 1991, pp. 52-54.
19. Curtis, J.B., Potential Gas Committee reports unprecedented increase in magnitude of U.S. natural gas resource base, PGC Press Release, June 18, 2009, from www.energyindepth.org/wp-content/uploads/2009/03/potential-gas-committee-reportsunprecedented-increase-in.pdf, July 18, 2009.
20. Natural Gas Markets: National Overview, Federal Energy Regulatory Commission, May 2010, from www.ferc.gov/market-oversight/mkt-gas/overview.asp, June 1, 2010.
21. Statistical Handbook, Canadian Association of Petroleum Producers, Calgary 2010, from www.capp.ca/library/statistics/handbook/, June 1, 2010.
22. Benneche, J., "Natural gas projections from EIA and six others," EIA Energy Outlook, Modelling and Data Conference, Washington, DC, Mar. 28, 2007, from www.eia.doe.gov/, June 6, 2010.
23. Vandenborn, C., "Unconventional Gas," IRR's Inaugural Shale Gas Briefing, Brisbane, Mar. 30, 2010.
24. Mitchell, B.R., International Historical Statistics: The Americas and Australasia, Gale Research Co., Farmington Hills, Mich., 1983.
The authors
More Oil & Gas Journal Current Issue Articles
More Oil & Gas Journal Archives Issue Articles
View Oil and Gas Articles on PennEnergy.com


