Method helps operators determine best times to shut down projects
Ken Kasriel David Wood | Click here for the complete Method A and Method B Excel files mentioned in this article. |
If the aim of investment activity is to maximize value to the investor, the time to end the activity is when the investor believes maximum possible value is achieved, before value is destroyed by continuing. To prevent such value destruction, upstream petroleum industry investments usually have some form of economic limit test (ELT) which determines that it is time to stop a project when forecast "value" (i.e., some definition of revenue minus some definition of costs) would otherwise turn irreversibly negative.
While this is appropriate, oil and gas companies commonly use ELTs which are flawed because they are based on incomplete measures of value. Although industry decision-makers do generally agree that the point of investment is to maximize value, specifically after-tax net present value (NPV) of future net cash flow (NCF)—i.e., all revenue received by the investor, less all costs incurred by the investor, discounted at an appropriate discount rate—in practice, commonly used ELT calculations erroneously measure something else.
Although potentially quite material, for example, abandonment costs and income taxes are usually ignored. In fact the latest (November 2011) Guidelines for Application of the Petroleum Resource Management System (PRMS) sponsored by the Society of Petroleum Engineers, Society of Petroleum Evaluation Engineers, American Association of Petroleum Geologists, World Petroleum Council, and Society of Exploration Geophysicists explicitly reiterates its previous (2007) stance that these two cost items should be excluded when calculating cash flows for the ELT. In the authors' view, abandonment costs and income taxes are real cash outflows which should not be ignored.
Flaws also occur in many ELTs used in investment decision models governed by production sharing contracts (PSCs) because these models simplistically define investor revenue as total field revenue times the investor's working interest. This can give misleading results as often investor revenue under a PSC is more complex to calculate and lower than total field revenue because investor PSC revenue consists of both reimbursement for actual costs incurred and revenue sharing with the host government under a specific formula. Under PSC terms, abandonment costs are often eligible for reimbursement to the investor; therefore, if abandonment costs are ignored, the "investor revenue" used for the ELT calculation will be distorted.
In yet another common flaw, many ELTs used in investment decision models are based on undiscounted cash flows.
ELTs with these flaws end up designed to maximize not the investor's NPV but rather a less meaningful variant thereof because they exclude certain investor costs, simplify (and thus distort) investor revenue, or ignore the time value of money.
In the authors' experience, investors do consider all these items, and do so correctly, when calculating NPV; the problem is that when calculating ELTs which influence the NPVs, they calculate something else. If maximizing investor NPV is the point of investing, then both the valuation and ELT calculations should focus on the same thing.
This article presents a simple, transparent, and mathematically sound approach to calculating the ELT which remedies the shortcomings mentioned above. By considering all actual investor cash inflows and outflows (including abandonment costs) and the time value of money, this method allows (to the extent that any forecast model can) the investor to time the abandonment decision to maximize investor NPV.
ELT: common flaws
Petroleum economic models should use an ELT which determines when a field should be abandoned on commercial grounds, even though continued but commercially unviable production is technically possible.
Common industry practice, in models used for internal business planning and regulatory reporting purposes, is to calibrate the economic limit to maximize a field's expected gross operating cash flow (GOCF). As used here, GOCF is a field's total "gross" (meaning 100% working interest basis) revenue, minus total gross recurring cash or cash-equivalent costs (e.g., royalties, taxes other than income taxes, and operating expenditures), but excluding capital expenditures, abandonment costs, and income tax. The GOCF used in this standard ELT approach is usually not discounted.
This common approach is flawed, given the industry consensus that the best measure of value to an investor is not total field GOCF but rather the investor's share of NPV—the sum of discounted future NCF which accounts for all cash and cash-equivalent costs (hereafter, "cash costs"), including the time value of money. An abandonment date designed to maximize field level GOCF will not necessarily be the same as one designed to maximize investor NPV. This discrepancy can arise because GOCF ignores potentially material cash outflows.
| This article summarizes a 15,000-word report available for purchase in the OGJ Online Research Center. The report incorporates more-detailed analysis of ELT methods accompanied by five Excel models—the example field case discussed here plus two detailed examples for production sharing contract fiscal terms and two detailed examples for tax-royalty fiscal terms, as well as comprehensive instructions of how to use those models. The report is at http://ogjresearch.stores.yahoo.net/oil-gas-reports.html. |
One such outflow ignored in the GOCF calculation is the cost of abandonment, specifically the timing of this cash outflow, whether it is made as a single lump sum at or after the end of the economic production life or comprises equal, periodic payments over the field's economic production life. A likely reason that abandonment cost, financed by either of these common methods, is excluded as a deduction in conventional ELT calculations is that to try to include it as a cost which helps determine when to stop producing can easily lead to circularity. One needs to know the abandonment date in order to determine the ultimate value of the abandonment cost. But to know this ultimate value of the abandonment cost one needs to know the abandonment date.
When abandonment costs are paid as a single sum at or after the end of the commercial production life, the ultimate value of this sum depends on when it is incurred because of time-value-of money effects—i.e., inflation and discounting.
When abandonment costs are paid as equal, periodic payments over the field's economic production life, the total, ultimate value of these payments depends on two key factors: the time-value-of-money and the length of the economic production life, which controls the magnitude of each equally sized, periodic payment.
For example, a $100 million total abandonment cost, spread over a 10 year production life, would result in 10 payments of $10 million/year, which a field could perhaps sustain each year and thus remain profitable and economic in all 10 years; whereas a $100 million total abandonment cost spread over a 5 year production life would result in five payments of $20 million/year, which the same field could perhaps not sustain each year and thus would be shut down at some point during those 5 years as subeconomic. The problem with including such costs in an ELT to determine abandonment timing is, again, circular, because the length of the economic production life depends on the size of the payments, which in turn depend on the length of the economic production life.
Attempting to solve this circularity via iteration is fraught with problems and not recommended. Our method uses a modeling approach which circumvents this circularity issue.
The inability to account for abandonment costs when using GOCF to calculate the ELT thus not only ignores abandonment costs themselves—which are real and often material cash outflows, particularly in remote offshore locations or environmentally sensitive onshore locations—but also has distorting knock-on effects.
Because abandonment payments are often income tax deductions, ignoring them precludes correctly calculating income tax. In fact, the recently issued PRMS guidelines explicitly state that the ELT calculation should ignore both abandonment costs and income taxes:
"Economic limit is defined as the production rate beyond which the net operating cash flows (net revenue minus direct operating costs) from a project are negative, a point in time that defines the project's economic life…. Operating costs should include only those costs that are incremental to the project for which the economic limit is being calculated. In other words, only those cash costs that will actually be eliminated if project production ceases should be considered in the calculation of economic limit. Operating costs should include property-specific fixed overhead charges if these are actual incremental costs attributable to the project and any production and property taxes but (for purposes of calculating economic limit) should exclude depreciation, abandonment and reclamation costs, and income tax, as well as any overhead above that required to operate the subject property (or project) itself." (Emphasis added.)
Problems arise with the idea that "only those cash costs that will actually be eliminated if project production ceases should be considered in the calculation of economic limit." Abandonment costs do not fit this definition—uniquely, they are a liability which will not be eliminated when the project ends and in fact will occur precisely because it ends. They should by no means be ignored in the ELT calculation.
Another potential distortion arises with PSCs, under which abandonment payments are often cost-recoverable and so determine a major source of investor revenue: cost petroleum. Ignoring them in the ELT calculation precludes correctly calculating the investor's actual share of contractor revenue in the ELT calculation.
Alternative ELT approach
Proposed here is a method to calculate an economic limit which maximizes investor NPV—which, again, accounts for all investor cash costs, including abandonment costs and income taxes, as well as actual investor revenue—while avoiding circularity problems.
The method is very simple in concept and to implement and verify in common cash flow-analysis software packages and Excel spreadsheets. Its basic steps:
• Run the economic model once for each conceivable abandonment date in the time horizon being modeled (e.g., in an annual model with a 10 year timeframe, run the model 10 times, each time assuming that abandonment occurs in a different year). This can be accomplished with a short Visual Basic for Applications (VBA) macro, obviating the need to build multiple copies of the model.
• Collate the results of these models.
• Choose the abandonment date which results in the highest investor NPV, considering abandonment costs, over the project life. This is the recommended abandonment year which should be used to inform decision-makers.
This article shows, in simplified examples, how to calculate the economic limit using variants of the GOCF-based approach—which we term "Method A"—and using the proposed investor NPV-based approach—"Method B."
Method A
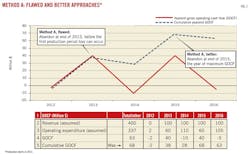
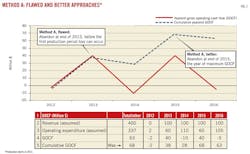
There are two approaches to method A, one more flawed than the other. Fig. 1 provides data for a simple field case, ignoring income tax, which helps to distinguish the two approaches to Method A.
Once production starts in the Fig. 1 time line, operating expenditure exceeds revenue twice, in 2014 and 2016, resulting in negative GOCF in those years.
The most flawed version of Method A would be to shut this field down in 2013, once cumulative GOCF reached $38 million, to prevent any annual GOCF loss, such as the $10 million loss in 2014, from occurring.
A less flawed (though still flawed) version of Method A considers GOCF throughout the entire technical production life and ends the economic field life in the last period before GOCF turns permanently negative. In effect, this defines the last year of economic production as the year (2015) of maximum cumulative GOCF ($68 million). The approach then simply times abandonment payments accordingly and eliminates all other cash flows in years beyond 2015 from the subsequent NPV calculation. It is to this less-flawed approach to Method A that the preferred ELT method will be compared.
Row 5 in the table with Fig. 1 shows that this less-flawed approach to Method A achieves its objective of maximizing cumulative GOCF. When truncated to the economic limit year, cumulative GOCF of $68 million is achieved, exceeding total GOCF involving all years of technical production (2016 cumulative GOCF of $63 million) if no ELT had been imposed.
However, this approach to Method A is flawed because:
• The calculation of GOCF excludes abandonment costs. Shutdown timing should be designed to maximize not GOCF but rather an all-inclusive, "post-everything" cash flow—or NCF.
• From a valuation standpoint, GOCF is only a stepping stone to determining NPV; therefore, GOCF maximization should not be the aim of the ELT calculation. Rather, the ELT should optimize NPV.
One reason abandonment costs are excluded in many models from the GOCF-based ELT calculation—i.e., when GOCF is used to determine abandonment timing—is that trying to include abandonment costs in the calculation can lead to the circularity mentioned earlier. Method B is specifically designed to avoid such circularities.
The amount of actual abandonment costs incurred actually depends on when they are incurred, a value influenced by the year and the inflation rates in years preceding that year. Abandonment payments can be incurred in two main ways:
1. When abandonment costs are paid as a single lump sum at the end of the economic production life.
2. When, as is increasingly common internationally, abandonment costs are paid into a fund—e.g., as periodic installments over all or a portion of the economic production life. The size of these annual payments depends not only on inflation but also on when abandonment occurs. In the earlier example, when the total abandonment cost is $100 million, equal annual installments will be $10 million or $20 million for fields with economic lives of 10 or 5 years, respectively. Many governments now require operators to accrue over the production life of a field in some manner the cost liabilities associated with future decommissioning. This approach is to provide countries with protection against the risk of field equity-holding companies trying to avoid those liabilities, not having sufficient financial resources to meet them once production has terminated, or being bankrupted in the interim.
Models which attempt simplistically to include abandonment costs as deductions in an ELT calculation can run into difficulties, particularly in cases where abandonment funds are accumulated over all or a portion of field life. This is because annual contributions to the abandonment fund vary depending upon the year in which abandonment is forecast to occur. If iteration is not to be used to solve this, how might such models be built?
Method B
Method B defines what should be the last year of production as the stopping year which maximizes investor NPV. It works by applying a simple optimization routine:
• Either building enough separate models or, preferably, using a short automated routine (such as applying a VBA macro in Excel) to calculate NPV for every possible economic life span (calculating the impact of field shutdown in each year of field life).
• Compiling the resultant life spans and corresponding NPVs.
• Determining the life span which produces the highest NPV.
• Designating this as the optimal field life span.
Field example
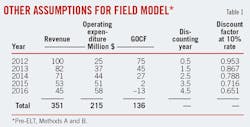
A comparison of Methods A and B uses a model based on a mature (no annual capital expenditure required), rather marginal field with only 5 remaining years of technical recovery possible (referred to here as the "example field"). The model goes beyond the GOCF calculation by including income tax (assuming a simple 50% tax rate and no carry-forward of tax losses) in calculating annual discounted net cash flow (DCF) and the sum of annual DCFs—i.e., NPV, as at Jan. 1, 2012, assuming a 10% discount rate and midyear discounting. Total abandonment costs, to be funded by equal, tax-deductible payments over the economic production life, are assumed to be $80 million. For simplicity, no inflation is assumed. Other assumptions appear in Table 1.
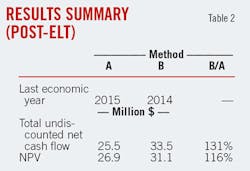
As shown in Table 2, under these assumptions, Method B suggests ending production 1 year earlier than Method A to gain a 16% improvement in NPV.
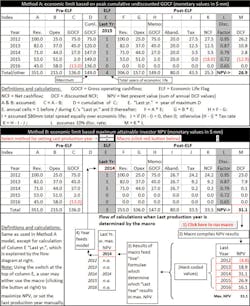
The complete Method A and Method B Excel versions of this model for the example field case described in Tables 1 and 2 are available to Oil & Gas Journal subscribers via a link that appears with the on line version of this article at www.ogj.com. Fig. 2 describes all the calculations.
The following section draws from this model to compare how the two methods determine ELT and NPV for this field example.
The Method B model works as follows (based on results shown in Fig. 2):
• First, the macro in the Method B model (the second model in Fig. 2) sets the "Last Yr" cell in column E to 2012 and stores the resulting NPV of negative $4.8 million as a hard-coded value in the table in the lower right corner of the figure.
• Next, the macro sets the "Last Yr" cell in column E to 2013 and records resulting NPV of $18.9 million in the lower-right corner of the figure.
• The macro continues in this manner, running the model assuming, in turn, that the "Last Yr" is 2014, 2015, and 2016, and storing the corresponding NPV results.
• Live formulas in the work space in columns D and E, below the Method B model, select the optimum ELT year by selecting the one which produces the highest NPV (i.e., 2014). Producing this answer is the fundamental point of Method B.
• In addition, it can be useful—though not essential—to help show the underlying calculations behind Method B's "prescribed" optimal stopping year by then feeding the Method B model its own medicine.
• That is, the optimal stopping of 2014—as determined by the macro-complied table and the formulas, both in the work space below the Method B model—is then fed into the Method B Model's "Last Yr" input cell in column E, causing the model to update accordingly. It will now show, using "live" formulas, the calculation of the detailed cash flow for the field when the optimal stopping year is assumed.
A sign that the Method B macro works correctly is that when the model's "Last Yr" cell is 2014, the model calculates an NPV (in column M) of $31.1 million, a number that matches the optimum value in the lower-right results table in Fig. 2. In fact, the user can manually enter any of the other stopping years into the "Last Yr" cell and see that the resultant NPV in column M matches what the lower-right information in the figure says NPV should be when that stopping year is used. Thus the macro is nothing more than an automated results compiler.
From a spreadsheet mechanics perspective, the main difference between the Method A model (the top model in Fig. 2) and the Method B model is in how the last year of economic production (i.e., the value in the cell below each model's "Last Yr" caption in column E) is calculated. For Method A, it is the year of peak cumulative GOCF, calculated with only "live" formulas, while under Method B it is the year of last production which maximizes investor NPV and is calculated with hard-coded (static) values from various model runs compiled by the macro, from which the live formulas in the work space then discern which is the highest NPV and the associated stopping year.
For the example field illustrated in Tables 1-2 and Fig. 2, which has been kept highly simplified to make this example clear, Method B outperforms Method A. Such NPV outperformance is also evident in a number of more detailed, complex, and realistic examples that have been examined under production sharing fiscal terms, tax and royalty fiscal terms, and different abandonment funding methods. Depending on the assumptions used, in some cases Method B selects an earlier year than Method A to shut down the field; in other cases the reverse occurs. These examples appear in the longer report mentioned in the note accompanying this article.
Both Method A and Method B models use an economic limit flag (ELF), which assigns a "1" to years up to and including the economic shutdown year selected and a "0" in subsequent years (column E, Fig. 2). These act as multipliers which truncate cash flows according to the period determined by the ELT. Because the ELF is merely an expression of the ELT, the terms "ELT" and "ELF" are used interchangeably in the tables and discussion below.
Analysis of results
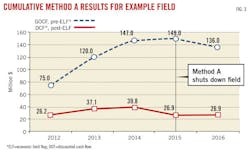
In the field example presented here, Method A does its job, at least according to the limited logic it applies. As seen in the upper curve of Fig. 3, it:
• Looks at cumulative, pre-ELF GOCF for each year of production.
• Determines that this peaks at $149.0 million in 2015.
• Shuts the field down once this peak is attained at the end of 2015, thereby avoiding the GOCF losses in 2016 which would have resulted if production had continued in 2016. These losses would have lowered cumulative project GOCF to $136 million.
The lower curve in Fig. 3, depicting post-ELF, cumulative DCF, however, shows that Method A has permitted value, by this measure, to be destroyed. By shutting down the field at the end of 2015, Method A results in NPV of $26.9 million, which is suboptimal.
The highest possible post-ELF NPV is not the highest point on the bottom line of Fig. 3; i.e., it is not $39.8 million in 2014. In this example, the highest post-ELF NPV possible is to be gained by shutting the field down at the end of 2014, as per Method B, and as shown in the Method B model in Fig. 2; but the resultant NPV is not $39.8 million. Rather, shutting down at the end of 2014 yields an NPV of $31.1 million—again, as seen in the Method B model in Fig. 2, and which is materially (16%) greater than the $26.9 million NPV resulting from Method A. But it is not to be seen in Fig. 3.
This is because when the last production year changes, the amount of annual abandonment payments changes as well. As the abandonment payments are a fixed amount divided equally over the economic production life in this example, shortening this life decreases the number of equal annual payments, thereby increasing their individual size. This in turn will impact related items such as tax liabilities (assuming, as we have in this example, and as is usually the case, that abandonment payments are tax-deductible) and of course DCF. Thus the abandonment payment, tax liability, and DCF in any given year will vary, depending on whether the field shuts down in Year 2, 3, 5, 10, etc.
This can be seen in the comparison of Method A and Method B results in Fig. 4, which shows the components of post-ELF, annual-basis DCF for when the final economic shut-in year is 2015, as suggested by Method A, and when it is 2014, as suggested by Method B.
In these charts, the height of the captioned white diamonds, signifying annual DCF, is equal to height of revenue minus that of all costs. In Fig. 4a, for example, 2012 revenue of $95.3 million (the black column) minus 2012 total costs of $69.1 million (the bottom of the combined stack of red, grey, and white columns) equals 2012 DCF of $26.2 million.
Revenue and operating expenditure, which are unaffected by the shutdown year, are the same in 2012-14 under both Method A and Method B. But the abandonment payments, and thus the tax charges and DCF values, differ in those years.
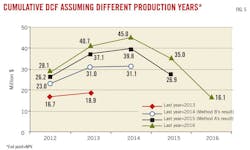
Fig. 5 illustrates the result for every run of the model (when the last economic year is assumed to be 2013, 2014, 2015, or 2016). In Fig. 5:
• The 2015 line, depicting the Method A result that the economic life should end in 2015, is the same as the bottom line shown in Fig. 3; here, however, the lines for this and the other scenarios have not been extended after their final year.
• The numbers at the right end of each line represent the cumulative discounted cash flow values (NPV) that can be achieved by shutting down the field in the year specified by the scenario. The 2014 shutdown year, suggested by Method B, yields the highest cumulative NPV.
• The apparently higher 2014 value of $45 million on the 2016 shutdown curve cannot be achieved as an NPV. When the field shuts down in 2016, cumulative DCF as at 2014 declines thereafter due to negative DCF in 2015 and 2016.
• The line with the highest cumulative DCF endpoint (project NPV) is the 2014 line. This is why Method B chooses this year to be the last economic year.
Timing abandonment
Using Method B to determine the ELT is a better approach to upstream petroleum valuation modeling than Method A, as Method B provides insights into when to time project abandonment to maximize investor NPV, which should be the point of investment.
Method B does this by taking into account real, often material factors ignored by Method A, including abandonment costs, income taxes, the investor's actual revenue, and the time value of money.
Method B, moreover, works simply and transparently. If initially one does not understand or doubts Method B's conclusion that abandoning a project in a given year maximizes NPV, this conclusion is easy to check. The models supplied with this article, for example, include a feature to override the use of the abandonment dates suggested by either Method B or Method A, and instead to manually select another abandonment date. Because the models show the full details and "live" calculations behind the NPV resulting from any chosen abandonment date, one can see that no other abandonment date will result in a better NPV result (meaning a higher positive NPV; or, if the field simply can never be NPV positive, then a less negative NPV) than Method B, and why.
Acknowledgment
While the views expressed here are those only of the authors, the following experts provided comments and criticisms which ultimately shaped this article: Manijeh Bozorgzadeh, Jim Bradly, John Davies, Ed Jankowski, Anthony Miller, Juan Lopez Raggi, Roy Wikramaratna, and Saqib Younis at RPS Energy; Michiel Stofferis at CEPSA; Olumide Talabi at OMV; and Otto Aristeguieta at Chevron.
Bibliography
Society of Petroleum Engineers, American Association of Petroleum Geologists, World Petroleum Council, Society of Petroleum Evaluation Engineers, and Society of Exploration Geophysicists, "Guidelines for Application of the Petroleum Resources Management System," November 2011, at http://www.aapg.org/geoDC/PRMS_Guidelines_Nov2011.pdf.
The authors
Manuscripts welcomeOil & Gas Journal welcomes for publication consideration manuscripts about exploration and development, drilling, production, pipelines, LNG, and processing (refining, petrochemicals, and gas processing). These may be highly technical in nature and appeal, or they may be more analytical by way of examining oil and natural gas supply, demand, and markets. OGJ accepts exclusive articles as well as manuscripts adapted from oral and poster presentations. An Author Guide is available at www.ogj.com, click "home" then "Submit an article." Or contact the Chief Technology Editor ([email protected]; 713/963-6230; or fax 713/963-6282), Oil & Gas Journal, 1455 West Loop South, Suite 400, Houston, TX 77027, USA. |
More Oil & Gas Journal Current Issue Articles
More Oil & Gas Journal Archives Issue Articles
View Oil and Gas Articles on PennEnergy.com
