Determining positional inaccuracies in directionally drilled wells
WELLBORE POSITIONING—1
Calculated borehole position may be erroneous in over half of the horizontal wells drilled during the past 15 years, according to the results of an ongoing industry study of continuous vs. stationary survey measurements. In a typical horizontal well, positional error of as much as ±25 ft true vertical depth (TVD) can accumulate. This study found that several generally accepted directional drilling and well surveying practices are primarily responsible for these errors.
The directional well surveying industry has used the minimum curvature method as its standard means to calculate the position of a wellbore from stationary inclination and azimuth measurements, and the distance between surveys has crept up from 30 to 90 ft. The assumption in the minimum curvature method is that there is a constant radial arc of curvature between survey stations.
This study of continuous direction and inclination survey measurements taken over significantly shorter intervals has found many instances where the constant radial arc assumption was not valid and in each instance resulted in a small positional error. In cases where the positional error was systematically repeated en route to total depth, a significant overall error resulted.
The accumulation of large positional errors during drilling can lead to poor and costly geosteering decisions that ultimately result in poorly placed wells, unplanned sidetracks, and lower recovery of reserves. The biggest impact of such errors to an operating company may be the mistaken addition or subtraction of hundreds of thousands of barrels of booked recoverable reserves per well.
Four sources have been identified that cause nonconstant curvature to occur between relatively long-spaced, 90-ft survey intervals. They are directly related to the mechanical aspects of directional drilling. The simple, short-term solution to reduce the amount of accumulated error is to take more surveys, although this will add to project cost. Alternately, a long-term solution is being developed that will allow real-time monitoring of directional tendencies and borehole position using continuous direction and inclination measurements.
This three-part series includes:
- Part 1: A look at where positional inaccuracies occur in horizontal wells and how frequently they happen when drilling with a conventional steerable, positive-displacement motor system.
- Part 2, Nov. 3, 2003: A review of similar inaccuracies while using rotary steerable systems and (or) encountering lithology changes.
- Part 3: A set of recommendations and techniques that can help to minimize the problem.
Illuminating the problem
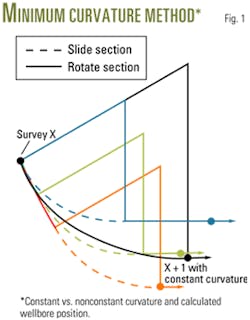
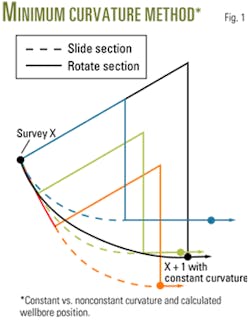
The minimum-curvature method has long been used as the standard means to calculate a wellbore's position from inclination and azimuth measurements by determining the smallest radius curvature between two survey stations. The black curve in Fig. 1 illustrates this assumption.
In this example there are two surveys, X and X+1. The position coordinates of Point X are given. The position coordinates for the second survey point, in terms of easting (X), northing (Y), and true vertical depth (Z), are calculated by fitting a constant radial arc to tie the two positional vectors together. The inherent assumption with this method is that the entire section will be drilled at a constant radius of curvature.
The late 1980s introduction of positive displacement motors (PDMs) with bent housings to the directional drilling market made it possible to freely switch between slide drilling with high curve rates (5-10°/100 ft) and rotary drilling with curve rates usually less than 1°/100 ft. Further, top drives on offshore and some land rigs have enabled drilling with three, 30-ft joints of pipe (a stand) without stopping to make connections.
As initial measurement-while-drilling (MWD) tools took three-axis, stationary directional measurements when the mud pumps were cycled off and on during connections, surveying intervals have also increased gradually to 90 ft from 30-ft spacing. Bottom line, the advent of PDMs and top drives has increased the probability that curve rates will vary dramatically between stationary survey points; that is, nonconstant curvatures will exist. Simply interpolating between these points will not reflect many of today's actual wellbore trajectories.
The blue, green, and red curves shown in Fig. 1 represent the alternate well path trajectories that end up with the same measured depth, azimuth, and inclination for Point X+1. These are based on different combinations of sliding and rotary drilling between the two survey stations.
In each case the arc length and radius of curvature for each curved slide-drilled section are the same (shown as dashed line sections). However, the placement of these curved sections is varied from being before (blue), in the middle (green), and at the end (red) of a rotary-drilled tangent section of hole (solid lines). The model illustrates the importance of knowing where changes of curvature exist along a well path trajectory.
Early example
In the late 1990s, MWD service companies modified their downhole data streams to include sampling of accelerometer and magnetometer data during pumping operations, especially drilling. Simplified single-axis surveys now can be transmitted to the surface in the same way that gamma ray and resistivity data are transmitted. Specifically, continuous direction and inclination measurements (cDNI) are made every 30-90 sec, which results in surveys that are 2-4 ft apart when drilling.
These continuous data are being used routinely by directional drillers for trajectory tendency work. However, continuous surveys are not yet deemed reliable enough to be used as definitive positional surveys, as work on error models for the cDNI data continues.
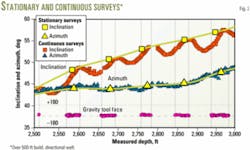
Fig. 2 compares stationary and continuous survey data over a 500-ft build section in a directional well. The straight lines connecting the stationary survey points, both inclination and azimuth, indicate a constant rate of curvature.
The slope changes of the continuous inclination data indicate the vertical build and drop rates achieved while slide drilling vs. rotary drilling, respectively. The PDM motor delivered about 13°/100 ft building when sliding with the gravity tool face (GTF) settings given. The bottom hole assembly (BHA) dropped at about 4°/100 ft when rotated, which is a dramatic but not unusual occurrence resulting from a less than optimal choice of BHA.
The curve rate calculated between the stationary surveys using minimum curvature is about 3.5°/100 ft. Following are details of how these differences in assumed versus actual curvature rates result in positional error.
Causes of positional error
Four primary sources of nonconstant curvature between long-spaced stationary surveys have been identified:
1.Slide or rotate directional drilling patterns accomplished with PDM steerable systems during the build, drop, and (or) turn sections of wells.
2.Systematic use of PDM steerable systems to compensate for build, drop, or walk tendencies when attempting to maintain or hold constant inclination and azimuth in a tangent well section.
3.Changing modes with rotary steerable systems between stationary survey points.
4.Lithology and (or) bed dip angle changes between stationary survey points.
Currently, concerns about wellbore position concentrate on differences in TVD. The positioning of a horizontal drainhole relative to fluid contacts and the construction of geological structure maps are based on TVD position. Changes in azimuthal location, while a valid concern, are of lesser importance at this stage.
Continuous direction (or azimuth) measurements have a wider fluctuation than continuous inclination measurements, as seen in the character of the Fig. 2 data. Thus, this article focuses on differences in TVD position, but the argument can be made for both TVD and azimuthal position.
Slide or rotate patterns
Fig. 2 shows a good example of applying a slide or rotate drilling pattern during the build section of a well. In this case the directional driller sets up a relatively consistent pattern of alternating between slide drilling and rotary drilling once per stand.
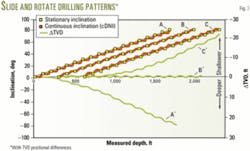
Fig. 3 shows three sets of slide (rotate) drilling models. Each case uses a series of 50-ft slide sections (building at 10°/100 ft) and 50-ft rotate sections with no build rate to go from an initial inclination of 0° to a final inclination of 90°. The position of the 100-ft stationary survey stations (yellow squares) is varied from being immediately after (A), in the middle of (B), or immediately before (C) a slide interval. The red squares show the continuous survey dataset for each of the models.
The difference between the TVD calculated using the stationary and continuous inclinations accumulates, as shown for each of the three modeled wells by the curves labeled A', B', and C'.
These show a swing of ±25 ft of accumulated TVD error. Note that when the slide section is placed in the center of the rotary drilled sections (B) the TVD errors cancel out (B'). While in practice directional drillers do not execute the perfect patterns shown, systematic patterns do present themselves.
A field study
There is no standard set of procedures for incorporating continuous directional data into survey calculations for dogleg severity or hole positioning. To determine the extent of wellbore TVD error resulting from slide/rotate drilling practices, a study was commissioned in August 2001.
Stationary and continuous survey data for thirteen horizontal wells in Nigeria, Angola and Indonesia were captured and processed. Directional operations data, BHA reports and slide sheets also were gathered.
Fig. 4 illustrates the general positional results of the study. (More detailed results can be found in Stockhausen and Lesso.1) Eight of the wells had TVD differences greater than 5 ft. The largest difference recorded (Well GBK "a") showed that continuous inclination placed the final TVD 22 ft deeper than the TVD calculated from the stationary surveys.
The three smallest positional errors recorded were in wells AMP "a," BKPorg, and BKPst1, which were drilled in Indonesia with rigs without top drives and using a standard kelly. While these wells were being drilled, surveys were taken at every joint of pipe, about every 30 ft, and slide (rotate) section lengths varied widely.
The shorter survey interval of 30 ft did not allow for large differences between the continuous surveys and the minimum curvature assumption to accumulate. Top-drive use in the other countries allowed for larger difference in inclination to accumulate between surveys, and thus a greater chance for TVD differences to occur.
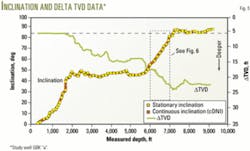
Fig. 5 shows the stationary and continuous inclination data for one of the Nigeria wells. The data cover the entire directional well from kick-off to TD at 9,033 ft. TVD calculations from continuous and stationary surveys had a 22-ft difference—deeper on the continuous survey. The delta TVD curve reveals how the error accumulated to reach a maximum difference of 23.7 ft at 7,310 ft MD.
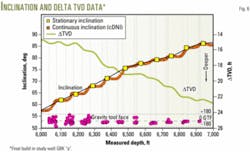
Details of the same well between 6,000 and 7,000 ft MD, in its final build to horizontal, reveal the true nature of the slide (rotate) pattern used (Fig. 6). Continuous inclination data show that angle builds while sliding and holds during rotary drilling. The stationary inclination survey points, taken at about 90-ft intervals, do not see this effect.
The line drawn between the stationary inclination points indicates the constant rate of curvature assumed by the minimum curvature method.
When the nonconstant curvature shown by the continuous surveys is below this line, the delta TVD accumulates, indicating that the well is increasingly deeper—or shallower when above the line. From 6,000 to 7,000 ft the overall delta TVD accumulates from 14 to 23 ft deeper.
It is important to note that in this well (Fig. 5) almost all of the TVD difference occurs as a result of attempting to build or drop angle. During the drilling of the hold sections (3,600–5,700 ft and 7,100–9,033 ft), the BHA did a good job of holding angle when rotary drilling. The continuous inclination tended to directly overlay the line connecting the stationary surveys and little or no delta TVD developed. Only when correction slides were made (near 4,700 and 7,700 ft) did TVD differences occur.
Two conclusions arise from this study:
1. A significant positional error is possible on 60% of horizontal wells studied.
2. Positional error can be greatly influenced by directional drilling procedures.
The probability is high that horizontal wells drilled with PDM steerable systems on a top drive rig will have a TVD positional problem large enough to cause well-placement problems. The obvious criticism of these conclusions is that 13 wells are not a large sample.
Additional wells have been reviewed from the study area, as well as from the North Sea and Gulf of Mexico. The process is ongoing, but to date the percentage seems to be holding.
Landing horizontal wells
TVD positional differences in horizontal wells, caused by nonconstant curvature in surveys, can lead to poorly placed drainhole sections or missing the target reservoir completely. Because neither operator nor service company personnel are typically aware of this problem, poorly placed wells usually are attributed to an unexpected change in geological structure.
An earlier study by Lesso and Kashikar2 noted that about 40% of horizontal wells encountered a "geological surprise" that resulted in a 10-20 ft TVD shift. With current knowledge in hand, it is interesting to speculate on how many of these shifts actually were caused by nonconstant curvature in survey calculations.
During geosteering operations, marker beds above the target reservoir are used to help determine wellbore position relative to the target. Trajectory adjustments are made accordingly, assuming that the vertical thickness and dip angles of the intermediate beds remain constant.
Petrophysical data modeling and navigation techniques developed over the last decade have made it possible to deal with most unexpected changes by maneuvering the drill bit to land the horizontal wellbore on target. But, additional TVD positional error can accumulate during the final approach to target, resulting in overshooting or undershooting the desired location and perhaps losing some lateral section.
Acknowledgment
The authors thank ChevronTexaco and Schlumberger for permission to publish this material.
References
1. Stockhausen, E.J., and Lesso Jr., W.G., "Continuous Direction and Inclination Measurements Lead to an Improvement in Wellbore Positioning," SPE/IADC Paper #79917, presented at the SPE/IADC Drilling Conference, Amsterdam, Feb. 19-21, 2003.
2. Lesso, Jr, W.G., and Kashikar, S.V.,: "The Principles and Procedures of Geosteering," IADC/SPE Paper #35051, presented at the IADC/SPE Drilling Conference, New Orleans, Mar. 12-15, 1996.
Based on a presentation to the SPE/IADC Drilling Conference, Feb. 19-21, 2003, Amsterdam.
The authors
Ed Stockhausen ([email protected]) is a senior research scientist for ChevronTexaco Exploration & Production Technology Co., based in Houston. Stockhausen graduated from the University of Florida with an MS in geology in 1981. Over the next 16 years, he held various exploration and production geology positions for Chevron in New Orleans, focusing on Gulf of Mexico area field development. For the past 5 years, Stockhausen has been responsible for leading the development and deployment of geosteering technology for ChevronTexaco worldwide.
Bill Lesso ([email protected]) is a drilling research advisor with Schlumberger in Cambridge, England. Over the past 21 years he has held various positions worldwide dealing with the development of drilling analysis products and drilling projects, with special emphasis on horizontal drilling and geosteering techniques. Previously, he worked in wireline petrophysical logging. Lesso holds several patents related to drilling mechanics. He obtained a BSc in mechanical engineering from the University of Texas.
