Merger, acquisition trend consolidates refining in US Northeast
The largest oil company mergers in US history have occurred within the past 2 years.
These mergers have contributed to a dramatic consolidation of refining in the US Northeast.
While unique in terms of size, they are nonetheless only the latest chapter in the process of oil industry restructuring and consolidation that has been under way since the 1980s.
Particular aspects of the latest wave of consolidations stand out. First, they are financially more cautious than the last round of big mergers that took place in the early 1980s. Second, the US Federal Trade Commission (FTC) has assumed a larger role in allowing large (but not giant) players to grow much bigger through the acquisition of prime assets forced onto the market.
In the US Northeast and the Mid-Atlantic regions, the changes in industry structure over the past several years have led to a significantly greater concentration of refining in the hands of new players and, at the same time, greater refinery capacity at usually lower costs.
The new players tend to have previously had a smaller retail presence than the majors, but this is changing as a result of new acquisitions.
Although refinery concentration is higher in this part of the country, the area is open to product imports and shipments from other regions, sharply reducing the possibility of anticompetitive actions that could diminish benefits gained from lower costs. Openness to product imports played a critical role, for example, in ending the price spike in heating oil last winter.
This article examines the drivers of the changes in industry structure and the implications of the changes to date, especially for the Northeast and Mid-Atlantic US regions.
Note however that, while the recent oil company mergers are spectacular within the industry, they are not quite the earthshaking events they would have been in earlier years. The current market capitalization of ExxonMobil Corp.- about $270 billion-is far less, for example, than the market capitalization of Microsoft Corp., Cisco Systems, or Intel Corp. (all over $350 billion as of April 17, 2000). But it is somewhat larger than the combined $230 billion market capitalization of the proposed merger participants America Online, Inc. (AOL) and Time Warner Inc. The oil and gas industry, after all, represents the "Old Economy."
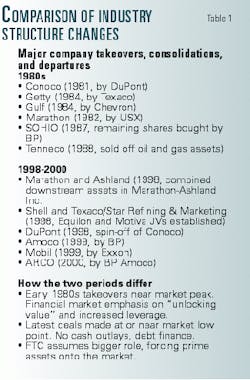
1980s vs. 1998-2000

The most recent developments with the last round of major takeovers and consolidations that took place in the 1980s are summarized in Table 1.
There were some very large takeovers in the early 1980s: Conoco Inc. (by E.I. Du Pont de Nemours & Co.), Getty Oil Co. (by Texaco Inc.), Gulf Oil Co. (by Chevron Corp.), and Marathon Oil Co. (by USX Corp). All involved large outlays of cash. With hindsight, some have proven disappointments and one, Getty's successful lawsuit forcing Texaco into bankruptcy, was an outright disaster. DuPont began the spin-off Conoco in 1998.
These mergers took place during, or not long after, oil market peaks. They also occurred at a time when financial markets favored "unlocking value" and increased leveraging of assets.
Toward the end of the 1980s, BP bought up the remaining shares of Standard Oil Co. of Ohio, and Tenneco Inc. withdrew from the business, selling off its oil and gas assets.
The latest round of mergers has been very different. The deals were conceived, although not necessarily concluded, at or near the low point in world oil markets. There have been no cash outlays and therefore no debt to finance.
This more-cautious, better-timed round should lead to better outcomes than the last one. The other major difference is the key role played by FTC, especially by compelling divestitures as a condition of approval, forcing prime assets onto the market. FTC required that the divestitures be completed in a manner that favored other large, competitive players.
Trends in oil demand
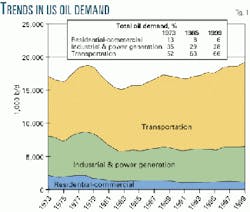
Several broad trends have encouraged the process of industry consolidation. Fig. 1, which focuses on the long-term trend in US oil demand, shows demand by sector from 1973 through last year. Overall, the pattern does not suggest a growth industry.
Total demand peaked at nearly 19 million b/d in 1978, fell by about 20% between 1978-83, and has grown very slowly since then. Only in 1999 did total demand move above its 1978 peak. Moreover, growth has been confined almost exclusively to one sector, transportation, which now accounts for nearly two thirds of the oil barrel, up from about half in the early 1970s.
The residential-commercial sector experienced a severe decline in demand, with most occurring in the 1980s. Today this sector uses only about half of the oil it consumed in the 1970s. Oil use by the industrial and power generation sector is also below its levels of the 1970s-by 10-15%.
Sharp declines, followed by sluggish growth at best, certainly encourages consolidation, and in some cases, outright withdrawal from the business. This was especially the case for major companies with respect to the retail heating oil business.
Trends in profitability
While minimal or zero sales growth encourages consolidations, the generally mediocre profitability of the industry since the early 1980s also is a reinforcing factor advancing and prolonging the process.
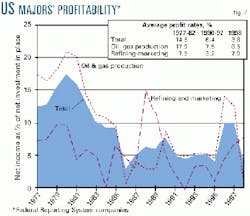
Fig. 2 shows trends in the reported profit rates of major companies on their total US petroleum operations and, separately, on the upstream and downstream segments. Major in this case refers to companies required to file reports under DOE's Federal Reporting System (FRS).
Data are shown for 1977-98. In the late 1970s and early 1980s, profit rates for major companies averaged nearly 15%, with the nearly 18% rate on production pulling up the just-under 8% rate on refining and marketing investments.
But since the mid-1980s, profit rates on total US petroleum operations have tended to be well below 10%, with the exception of 1996-97. For most of those years, profit rates for oil and gas production continued to lead refining and marketing.
In 1990-97, profit rates on production averaged a modest 7.5%, while returns to refining and marketing investments averaged only about 3%, less than the return on a bank Certificate of Deposit.
With such mediocre returns, especially downstream, the pressure for rationalization and consolidation was never-ending. In 1998, with the depression in world crude prices, the modest returns on production collapsed to near zero, with smaller producers suffering more.
The improvement in refining and marketing returns was not enough to prevent the major companies' overall profitability on US operations from falling to its lowest level since 1986.1 It was in this environment of extraordinarily depressed profitability that the latest rounds of megamergers were initiated.
Thanks to rising crude and gas prices, 1999 became a recovery year for oil and gas production profits. The US Department of Energy reports that net income from domestic oil and gas production for a sample of major companies nearly doubled last year.
On the other hand, net income from domestic refining and marketing of the sampled companies was down by nearly 30%, suggesting an interruption of the limited recovery in profitability that occurred in 1998.
These broad trends, in combination with a very difficult 1998, all contributed to spur the recent round of mergers and consolidations. The role of FTC has been critical in reshaping the industry and determining the changes in industry structure resulting from these developments.
FTC's role
As initially proposed, the "Big Oil" mergers and the Shell Oil Co.-Texaco JV raised FTC anticompetitive concerns. They saw no mitigating circumstances, such as the "failing firm" status of a proposed acquisition.
Moreover, divestitures per se were not enough to gain FTC approval. The agency insisted on divestitures to a "viable competitor," which in practice meant divestiture to a single large (but not giant) acquirer approved by FTC. As a result, each of the recent megamergers and the Shell- Texaco JV forced prime assets onto the market and created opportunities for already large firms to grow larger by acquiring them.
The big winners from this process include Tosco Corp., which acquired from [then] BP Amoco PLC 137 retail outlets in Pittsburgh and the Southeast, and even more important, 1,740 Exxon and Mobil branded stations in the Northeast and Mid-Atlantic. The latter acquisition greatly reduces Tosco's reliance on the wholesale market as the outlet for product from its Northeast refinery.
On the West Coast, Valero Energy Corp. has acquired Exxon's Benicia refinery in California plus 350 retail sites, while Tesoro Petroleum Corp. acquired Shell's Anacortes, Wash., refinery, along with 40 retail sites.
Most recently, Phillips Petroleum Co. has acquired ARCO's upstream assets in Alaska, at a stroke doubling its proven oil and gas reserves and oil production.
The majors and retail
What were the implications of all these changes for the oil industry in the Northeast and Mid-Atlantic areas of the country?
In early April, the Petroleum Industry Research Foundation Inc. (PIRINC) used the Yellow Pages, via Yahoo, to search for heating oil dealers and gas station listings within a small, but densely populated area-a 12-20 mile radius of Newark, NJ. The search found that there were no major brands to be found in the more than 100 heating oil dealer listings within the area.
This is no surprise, because the majors got out of the retail heating oil business years ago (Exxon as early as 1977). As would be expected with such a result, FTC has not been concerned about this segment of the industry in its investigation of the recent mergers (although it has looked at terminal operations).
Gasoline is another matter entirely. Within a 12-mile radius, there are about 100 Exxon-branded stations, 80 Amoco, 60 Shell, 50 Mobil, 30 Texaco, and 7 BP. There were no ARCO listings.
Just looking at the list, it becomes obvious that Exxon Corp. and Mobil Corp., especially, were going to have a problem with FTC in this area. Any FTC attempt to assess potential anticompetitive effects, micromarket-by-micromarket, within such a small area would take years, if it were possible at all.
Moreover, the companies would be forced to contest the findings on similar time and resource-consuming micro basis. The Newark area is just one of a number of such areas in New Jersey and other nearby states.
No wonder, in the end, FTC and the two companies agreed to cut the Gordian Knot and simply divest all the Mobil-branded stations in New Jersey and the rest of the Mid-Atlantic region and all Exxon stations in the Northeast as part of the settlement of the case. As noted earlier, these were all acquired by one of the region's largest refiners, Tosco, which also acquired the rights to continue to use the Mobil brand at its stations.
On the other hand, with so few BP stations in the area, FTC did not concern itself about New Jersey, or the entire Northeast, when assessing the BP Amoco merger. In this case, FTC has focused its attention mainly on Alaska and the West Coast, not the Northeast.
The same was true regarding the new JVs formed by Shell, Texaco, and Saudi Refining Inc., which combined refining and marketing assets on the Gulf and East Coasts into a new joint venture, Motiva Enterprises LLC, in 1998. No East Coast gasoline marketing divestitures were required, and today Motiva provides product to both Shell and Texaco-branded stations.
None of the megamerger partners, nor the Shell-Texaco JV, currently operates refineries in the Northeast, easing any FTC concerns in that regard. But this would not have been true several years ago. The region has seen major changes in ownership of refineries over the past several years. These changes in part reflect what has been happening across the US.
Changes in refining
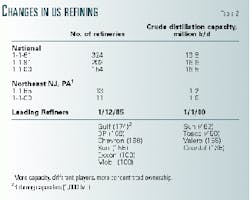
Table 2 focuses on changes in refining, first at the national level and then in the Northeast. At the national level, the most striking long-term development has been the decline in the number of refineries to about 200 in 1991 from over 300 a decade earlier and down to about 150 at the beginning of this year.
While the number of refineries has fallen by more than half, capacity today is down only about 15%, with little change since 1991. With the end of price and allocation controls in the early 1980s, there was an initial round of closures of very small refineries favored by those controls.
Since then, the average size of refineries has continued to increase as part of the ongoing process of rationalization. Although not shown, US refineries have also gotten more complex, with more deep conversion capacity and ability to respond to new environmental requirements, including production of oxygenated or reformulated gasoline. Currently, about one-third of all gasoline falls into these categories.
In the Northeast-New Jersey and Pennsylvania-the changes in number have been less drastic, falling to 11 at the beginning of this year from 13 in 1985. In contrast to the national trend, capacity has moved up-by 25% vs. the 1985 level.
Apart from physical changes, there have been two other striking developments over the past several years: the withdrawal of the majors from refining in this region and a more concentrated ownership of capacity.
At the beginning of 1985, the leading refiners in the region, shown in descending order of crude capacity, were Gulf, BP, Chevron Corp., Sun Refining & Marketing Co. (now Sunoco Inc.), Exxon, and Mobil. The largest refiner, Gulf, had refining capacity of 174,000 b/d, while the two smallest shown, Exxon and Mobil, each had capacity of 100,000 b/d.
The six companies accounted for about 70% of total refining capacity in New Jersey and Pennsylvania. At the beginning of this year, only Sunoco remained on the list. Gulf, BP, Exxon, and Mobil had all departed, while Chevron's interest (since reduced through sale of half of its refinery interest to Citgo Petroleum Corp.) was no longer large enough to make the list.
Sun itself acquired the former Gulf Philadelphia refinery. Three new players joined the lead group, Tosco, which acquired both the BP and Exxon refineries; Valero, which acquired the Mobil refinery; and Coastal Corp., which acquired the former Texaco refinery that, at 90,000 b/d capacity, were too small to make the earlier list. Together, this new, shorter list of four lead players accounts for nearly 85% of refining capacity in the region.
Higher concentration of ownership of the region's refining capacity does not necessarily mean problems for customers. The region is open to supplies from other parts of the country and from imports. Moreover, there is evidence that the new owners run lower-cost operations than the former owners.
Trends in PADD 1
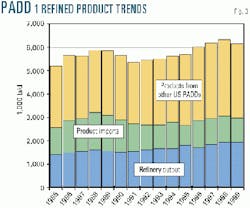
Fig. 3 shows trends since 1985 in the Petroleum Administration for Defense District (PADD) 1 refinery output, product imports, and product shipments from other US regions.
Refinery output, although growing, still represents only a small fraction of total supplies. In 1999, refinery output in PADD 1 was more than 1.9 million b/d, up from 1.4 million b/d in 1985.
But output from the region's refineries accounted for only 32% of all products produced or shipped to the region last year. This share was up from the 26% share of 1985 but still far too low to view the region as anything other than wide open to products from other sources.
About half of products produced in or entering PADD 1 come from other parts of the US, mainly from PADD 3, which includes the Gulf Coast refineries. Product imports accounted for just over 1 million b/d of supply last year, or about 17% of the total.
While product imports are by far the smallest component of the three product-supply sources, they have served as a critical safety valve for the region, as was demonstrated during the spike in heating oil prices in early 1999.
Distillate imports into PADD 1
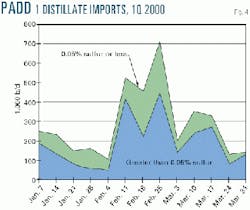
Fig. 4 shows the weekly movements in PADD 1 imports of distillate from the beginning of 2000 through the end of March. Imports surged from 100,000-200,000 b/d in the early weeks of the year to a peak of 700,000 b/d toward the end of February. Along with the end of severe weather in late January-early February, the increase in imports was the key factor in bringing the price spike to an end.
Imports have since moved back toward normal levels. Note that most of the imports was distillate with more than 0.05% sulfur, or heating oil.
Fuel specifications for distillate used as a transportation fuel are, of course, tighter than 0.05% sulfur both here and in other major regions. They are getting tighter still, with the US Environmental Protection Agency favoring the eventual move to near-zero sulfur. This means the cost of producing distillate for transportation uses will be moving up as EPA (and other environmental agencies) succeed in tightening specifications.
In principle, there would be advantages to having a uniform specification for distillate regardless of whether it is used for heating or transport. Distribution would be less complicated and less costly if the need for segregation of product were eliminated. But against these advantages would have to be set some potentially high costs.
Moving to a unified, tighter-spec distillate would mean higher costs for the fuel. More importantly, it would limit possibilities to shop the market, especially when local supply is tight, as was the case this past winter, because only tighter-spec sources could be tapped. The problem would worsen as uniform specs here tighten relative to distillates available elsewhere.
New entrants to FRS
Recent changes to FRS for major oil companies offer some evidence that the current owners of refineries in the Northeast run somewhat lower-cost operations than those they replaced.
Up until 1998, the FRS had focused on large oil and gas producing companies. As a result, data regarding refining and marketing operations included only the integrated, downstream operations of these same companies.
In 1998, the reporting system was expanded to include a number of large, independent refiners, including refiners operating in the Northeast. DOE added 11 newcomers to the list of major companies subject to FRS requirements, 10 of which were independent refiners.
These included Tosco, Sunoco, Valero, and Citgo, which have refinery operations in this region, and Motiva, which has marketing operations in the Northeast, although its refineries are elsewhere. The others were Tesoro, Equilon Enterprises LLC, Lyondell-Citgo Refining LP, Clark Refining Holdings Inc. (now Premcor Inc.), and Ultramar Diamond Shamrock Corp.
Data for 1998 indicated that the new entrants as a group run lower-cost operations than the incumbent integrated companies. The newcomers' raw material input and product-purchase costs per barrel were slightly lower ($13.94 vs. $14.17), while their direct operating costs per barrel were lower by nearly 90¢/bbl ($4.02 vs. $4.89). In an open market such as the Northeast, at least some of any cost savings would be passed on to customers.
Their average product realizations were also lower, a result of greater reliance on third-party sales. Only 36% of their gasoline volumes were sold through dealer and company-operated stations, vs. 50% for the integrated incumbents. Here, however, the recent mergers have created opportunities for adding retail volume, with the Tosco acquisition of 1,740 Exxon and Mobil branded stations the most spectacular example.2
References
- The downstream return shown for 1998 is somewhat exaggerated, because the sample for that year was changed to bring in more independent refiners, which tend to be more profitable in their operations than the downstream operations of the traditional integrated companies in the FRS sample.
- On the other hand, Tosco has expanded capacity significantly at its refineries, especially at its Linden, NJ, refinery. Currently, refining capacity at Linden is 250,000 b/d, up from 200,000 when it acquired the refinery in 1993.
The author
Ronald B. Gold is a consulting senior adviser to PIRA Energy Group and a consulting vice-president of PIRINC. He retired from Exxon Corp. at yearend 1997, where he was company economist and manager of the Energy Outlook division for Exxon Co. International. Gold also has worked for the US Treasury Department, Office of Tax Analysis, and was an assistant professor of economics at Ohio State University. Gold has an undergraduate degree from Brooklyn College, City University of New York, and an MA and PhD in economics from Princeton University.