US LTO market responds to global price decline
Peter Wells
Boston Petroleum Research
Winchester, UK
The steep decline in oil prices has led to deep capital spending cuts in the oil and gas industry. Integrated oil companies and the larger independents have announced cuts of about 25%. Smaller independents, especially those most exposed to light tight oil (LTO) plays in the US, generally have announced cuts of more than 40%.
Saudi Arabia is and will remain the most influential oil producer for the next decade, at least. Its policies will determine oil prices over that period and will have a significant effect on US LTO production
This article looks at how US LTO producers can respond to the new price environment in which OPEC, specifically Saudi Arabia, has abandoned a 30-year policy of trying to set a price floor by cutting production in times of oversupply. It also determines if US producers' response can affect global pricing.
Economically marginal production
Saudi Arabia's new market share policy is supported by its deep reserves. It has the near-term effect of enabling the Saudis to accommodate competition from rising Iraqi-and potentially Iranian-production without losing market share within OPEC. Saudi policy also suppresses high-cost marginal oil production, especially LTO.
LTO, however, is not the only economically marginal production at risk in the new price environment. Low prices compromise new projects and expansion phases in the Canadian oil sands, as well as frontier developments in the Arctic, ultradeepwater, and more remote deepwater regions.
The new price environment will slow or halt oil sands production growth. Production will continue from existing projects with costs <$50/bbl and other projects already underway to recover sunk costs.
We expect the Canadian oil sands to have significantly slower (or even zero) production growth over the next 5-10 years. Sanctioned projects will continue and add an incremental 300,000-450,000 b/d by 2018.
Our project monitoring database shows delay or cancellation of unsanctioned projects or those without much sunk cost. Canadian oil sands projects involving $60 billion of capital investment and 800,000-900,000 b/d of production will be affected over the next few years. Shell, for example, recently cancelled a 200,000 b/d project at Pierre River.
It will take almost a decade for reduced deepwater activity to lower production due to long development lead times.
Our earlier modelling for deepwater projects showed a sharp 2022-27 rise in production from new projects in the Gulf of Mexico, Angola, and Brazil. This rise is now likely to be delayed and more dispersed over the period 2024-30. Deepwater production in 2022-25 will be 1.0-1.5 million b/d less than previously forecast due to the impact of lower oil prices on capital budgets.
Our modelling of Russian oilfields shows that production in existing West Siberian fields will be affected by the absence of western technology and investment. This will result in declining production beginning in 2021, falling from about 10 million b/d to less than 8 million b/d by 2030.
The exploration and development of potential Arctic oil fields in collaboration with western oil companies are also likely to be delayed. Any new Arctic oil production will not be significant until the 2030s.1 Likewise, the development of Russia's LTO potential in the Bazhenov shale will probably be delayed until after 2025.2
The cumulative effect of these reductions could be substantial. OAO Lukoil's Leonid Fedun expects Russian oil production to decline by 800,000 b/d by the end of 2016.
LTO model
US LTO production grew to more than 3 million b/d at the end of 2014 from zero in 2007. LTO does not respond to capital expenditure cuts in the same way as other economically marginal production. This is because of their cost of production (>$50/bbl) is below current oil prices. For LTO, however, continuous drilling is needed to sustain production because of high-decline rates. Consequently, a major reduction in drilling due to capex cuts will lead to lower production despite improvements in well performance and efficiency.
Oil prices below the cost of new supply but above the cost of production lead to lower oil production. This is demonstrated by our LTO model, which uses data from thousands of wells.
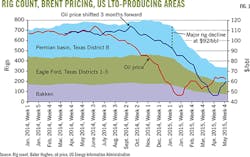
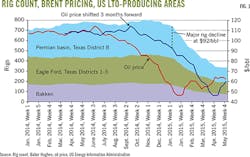
Fig. 1 shows the estimated drilling rig activity in the three main US LTO basins using data from Baker Hughes and Brent oil prices. All three producing areas show that if drilling activity declines by 25%, production stabilizes.
Production falls, however, at higher rates of decline. The latest data from Baker Hughes shows rig counts stabilizing in June 2015 ($60/bbl Brent) at levels about 55-60% lower than the peak counts in 2014 (Fig. 1).
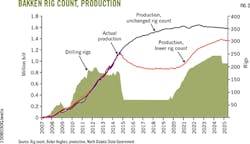
Fig. 2 shows Bakken LTO crude oil production with unchanged drilling rates and with less drilling. There is a match between actual production and the model through March 2015, the latest data available at the time this article was written. We estimate a 6-year period of low drilling activity through 2020 before drilling activity rebounds to 2014 levels.
Drilling-pricing relationship
The principal uncertainty in analyzing the relationship between drilling activity and oil price lies in the assumed time lag between falling prices, the decision to curtail activity, and the process of demobilizing rigs and unwinding commitments to contractors. We estimate this time lag to be about 3 months for the purposes of our model.
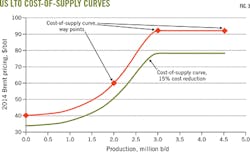
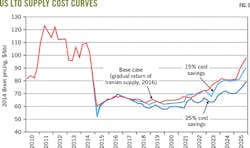
This reveals a point at which declining oil prices began to have an effect on drilling: 3 million b/d and $92/bbl (Brent) (Fig. 3).
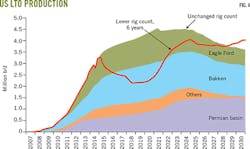
The model forecasts that sustaining drilling activity at peak levels reached in 2014 would yield maximum US LTO production of about 4.5 million b/d. This defines the terminal point on the cost of supply curve (Fig. 3). It also forecasts a 1-1.2 million b/d drop in overall US LTO production due to the 55-60% drop in drilling activity (Fig. 4). This yields a further waypoint on the cost-of-supply curve of 2 million b/d at $60/bbl. New US LTO production is assumed not to be significant at oil prices below $40/b (Brent), a waypoint that rounds out the estimated US LTO cost-of-supply curve(Fig. 3).
The derived cost-of-supply curve shows that even quite significant cost savings would not add a great deal to US LTO production. A 15% effective cost reduction would add only 250,000 b/d to US LTO production.
Model inferences
The total time lag between declining prices and reduced production is about 6 months. This includes 2-3 months for wrapping up drilling operations and contractual commitments, and 3 months for the reduced drilling to affect production.
The response of US LTO to oil price signals is slow. In addition to the 6-month lag, our models show it takes 12 months for half the decline to occur and 36 months before prices fully affect production (Figs. 2 and 4).
The slow response is due to low initial-production rates and high decline rates of LTO wells. Sustaining meaningful production requires a large number of wells. It takes 12 months to realize a fall or rise of 500,000 b/d in US LTO production. Saudi Arabia has 5 times this production in spare capacity and can make it available in less than 3 months.
We have also modeled the impact of higher and lower US LTO production on the future trajectory of oil prices.
Fig. 5 shows the price forecast to 2025 if there is no reduction in US LTO cost of production, and two variations with 15% and 25% cost reductions. While there is not much difference with a 15% cost reduction, the forecast widens to $10/bbl by 2025 if a 25% cost savings can be realized.
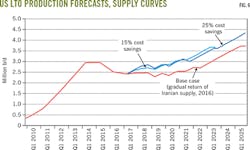
Fig. 6 shows total US LTO production. Even with the estimated cost savings, US LTO production is only about 500,000 b/d higher after 2019 than if there is no reduction in the cost of production.
Global supply
The rise in US LTO production, together with sluggish global demand, has contributed to high global spare capacity and falling oil prices. Slow response time (>12 months) and relatively small increments of production involved (<500,000 b/d), mean US LTO production can't affect oil prices in the short term.
The market is more sensitive to whether or not sanctions on imports of Iranian oil are lifted and whether or not Libya stabilizes than it is to US LTO production. OPEC and Saudi Arabia can also affect the market more quickly and in greater volume; millions of b/d over a few months.
References
1. Milne, R., Adams, C., Crooks, F., "Oil Companies Put Arctic Projects into Deep Freeze," Financial Times Online, Feb. 5, 2015.
2. Chazon, G., Farchy, J., "Russia Arctic Energy Ambitions Jeopardized by Western Sanctions," Financial Times Online, Sept. 1, 2014.
The author