Ohio seismic reflection data reveals direct hydrocarbon indicator
Dominique M. Haneberg-Diggs
Scott Bey
Doyle R. Watts
Ernest C. Hauser
Wright State University
Dayton, Ohio
Thomas F. McGovern
Seismic Earth Resources Technology
Castle Rock, Colo.
Steven L. McCrossin
Precision Geophysical Inc.
Millersburg, Ohio
Older strata may yield direct hydrocarbon indicators (DHIs) in environments typically thought unlikely to contain them. DHIs are features in seismic reflection data attributed to accumulations of oil and gas. Most examples of DHIs appear in offshore data in reservoirs comprised of Tertiary rocks generally in the Gulf of Mexico or similar "soft rock" settings.
One notable recent exception is the application of AVO analysis to Pennsylvanian reservoirs in the Anadarko basin.1 The lack of published examples of DHIs in Ohio and similar settings perpetuates the idea that older Paleozoic strata are too hard for DHIs to be present. This common misconception implies that the strata are so old and consolidated that despite the presence of natural gas or other fluid, there is not a significant enough effect on bulk elastic properties related to impedance for DHIs to be observed.
Offshore seismic data are generally of significantly higher quality than onshore data, and better reveal attributes associated with DHIs. DHIs therefore are excluded from exploration strategies in the interpretation of seismic data from Paleozoic rocks in areas such as Ohio's Appalachian basin.
Gas shadows
This article describes a gas shadow revealed by one of Wright State University's 2D seismic reflection lines collected over Dominion East Ohio's Gabor gas storage field near North Canton, Ohio.2 3
Gas shadows were first noted in the late 1970s. They were described as "low-frequency shadows" obscuring the reflectors immediately underlying conventional gas reservoirs, while leaving deeper reflections seemingly unchanged.4 The mechanism causing gas shadows remains unknown. The complex attributes of instantaneous frequency and phase described in this early study are useful in highlighting gas shadows on processed seismic sections.
More recent work on the subject outlined potential mechanisms that might cause gas shadows, separating them into "stack-related" or data processing issues and "nonstack-related" issues caused by natural gas's intrinsic absorption of seismic waves.5 Gas in a reservoir can cause processing issues because of its effect on the propagation of seismic waves. Corrections for the velocity of these waves at different intervals in the subsurface are crucial to accurately processing seismic data.
Pores filled with gas generally slow elastic waves. Abrupt changes in velocity make choosing correct or appropriate stacking velocities very difficult, and velocity analysis may be difficult if the gas shadow effect is strong. Effects such as intrinsic attenuation of seismic waves can also cause any number of processing problems. The local presence of gas causes changes in the elastic properties of the medium by increasing compressibility. The increased compressibility leads to an increased opportunity for energy loss due to internal friction, resulting in absorption or intrinsic attenuation.
The earth tends to attenuate higher frequencies preferentially. Gas-filled reservoirs appear to be particularly effective at high-frequency absorption. A recent case history in the Gulf of Mexico highlighted the importance instantaneous spectral analysis in identifying gas shadows.6 In that example, there is an apparent enhancement, even amplification, of low frequencies beneath the reservoir, accompanying the attenuation of high frequencies.
A variety of factors may cause amplitude variation and can lead to ambiguous interpretations in certain circumstances. A laterally varying deltaic deposit lying beneath an unconformable surface, for example, could lead to varying seismic velocities. These changes in velocity in turn alter the seismic expression of the unconformable surface. The changes in seismic expression might include both high-amplitude and low-amplitude anomalies related to interference rather than attenuation.
Clinton interval study area
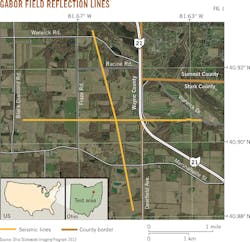
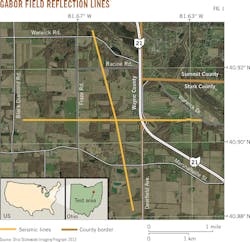
The Dominion East Ohio Co. operates gas storage fields in northeastern Ohio to supply residents of the area with natural gas. Wright State University collected a vibroseis-sourced seismic reflection line over the Gabor field, one of the smaller gas storage fields near Wayne, Stark, and Summit Counties (Fig. 1).
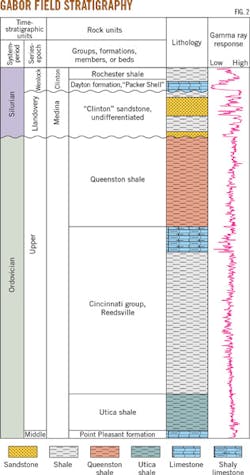
Dominion uses injection wells to store gas in the Silurian Clinton interval. Drillers mistakenly named this interval Clinton when it was first encountered more than 100 years ago. The drillers miscorrelated the interval to the overlying Clinton group, when in fact it belonged to the Medina group (Fig. 2). This miscorrelation was later identified; but the name was too entrenched in the literature to be changed. This article will refer to the deposit as the Clinton interval, consistent with the current informal status of this portion of the Ohio subsurface stratigraphy.
The Clinton interval is a fluvial deltaic deposit in eastern Ohio consisting of interbedded sandstones and shales which, for the purposes of this discussion, remain undifferentiated (Fig. 2). Immediately overlying the Clinton interval is what drillers refer to as the Packer Shell. The Packer Shell, which is correlated with the Dayton formation, is a continuous Silurian limestone producing a prominent reflector on Ohio seismic sections.
The Clinton interval has been an oil-and-gas target in Ohio since 1887, and some of its depleted reservoirs are used for natural gas storage. The sheer number of wells drilled, mainly during the 1930s, into the Clinton oil-and-gas play allows good structural control in the vicinity of Dominion's gas storage field.
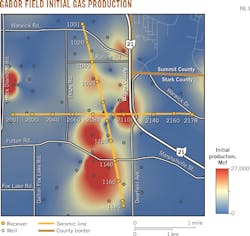
Modern openhole well logs are available only for the few development wells in the main fields. The lack of modern well logs means reservoir quality was ascertained mainly from initial production. Fig. 3 shows initial gas production in the Gabor field from wells which were subsequently converted to storage. This map of initial production is an approximated aerial extent indicator of the best reservoir quality within the Clinton interval to store natural gas.
Seismic method
In January 2011, Wright State University collected two intersecting vibroseis seismic lines across the then snow-covered Gabor gas storage field (Fig. 3). The north-south line had 185 stations and the east-west line had 178 stations, both with a station spacing of 82.5 ft. Each recording station used an array of six geophones, with individual 10 hz geophones spaced at 15-ft intervals.
A single vibrator completed two 8-128 hz sweeps at each source point without move up and a 12-sec listening time. The first sweep objective was to compact any loose soil and snow for better base plate coupling for the second sweep. A seismic recorder simultaneously recorded uncorrelated data for both lines at a 1-ms sample interval with a 3-205 hz recording filter. The seismic lines were processed with pre-stacked and post-stacked migrated sections.
The gas storage field was fully charged at the time of data acquisition. It is not possible to determine the exact pressure of gas in the reservoir at any time; but at fully charged conditions, it is likely that the pressures are higher than those that existed in the natural reservoir. This study used seismic amplitude, average frequency, and instantaneous frequency to identify an anomaly and characterize it as a gas shadow.
Reflection identification
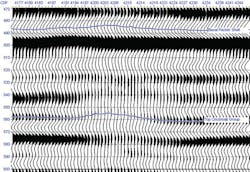
Fig. 4 shows a portion of the migrated east-west seismic line crossing an area of high initial production at common depth point (CDP) 4210. Synthetic seismograms from sonic and density well logs from nearby wells identified reflections.
The strong negative reflection at 500 ms in Fig. 4 is associated with the Packer Shell. Below that are several reflectors, one of which corresponds to the top of the Cincinnati group. The Clinton interval reservoir will not show as a separate reflector at the resolution of seismic data, but its effect is apparent in the attenuation of otherwise continuous reflectors from the Packer Shell to below the top of the Cincinnati group.
The seismic data show a reduction of amplitude within the zone below the top of the Clinton interval where the seismic line crosses Gabor field, corresponding with the high initial production shown in Fig. 3. In this particular portion of the Clinton interval, high initial production and subsequent excellent reservoir quality reflected in the initial production map demonstrate that the attenuation is associated with the gas reservoir.
This is characteristic of the DHI known as a low-frequency shadow or gas shadow. The attenuation is evident within reflectors above and below that corresponding to the top of the Cincinnati group as shown in Fig. 4. The limestone beds and calcareous shales at the top of the Cincinnati group produce a reflector at about 560 ms (Fig. 4), which is attenuated by the gas shadow. The effects of attenuation are observed extending beneath the reservoir to about 590 ms.
No shot point skips, reductions of CDP fold, or change of vibrator energy levels or other feature in the data acquisition process exist that could cause this attenuation. Beneath 590 ms there is no observed attenuation of other continuous reflectors. Unfortunately, there are no modern geophysical well logs to determine the precise character of the Clinton interval at this location and corroborate the initial production information, this study relying instead on the initial production map for such information.
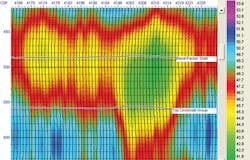
Amplitude attenuation is not the only signature of gas shadows. Frequency content is also very important. Gas has the tendency to attenuate high-frequency energy preferentially, leaving the gas shadow with anomalously low-frequency content.6 In some cases, not only are the high frequencies attenuated, but the low frequencies are apparently amplified. In the Gabor gas storage field data a low-frequency anomaly, correlating with both the area of high Clinton initial production and the amplitude anomaly, lies at 470-570 ms in the average frequency attribute plot shown in Fig. 5.
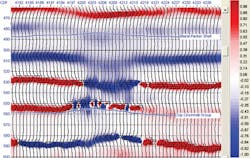
Another attribute that may highlight or reveal a gas shadow is the instantaneous frequency attribute of the seismic data.4 Instantaneous frequency is calculated by converting each seismic trace into a complex vector by using the trace itself as the real component and a 90-degree phase shifted equivalent of the original trace as the complex component. The attribute itself does not have any particular physical basis but is useful in highlighting anomalous areas and is commonly applied to seismic data as a correlation tool that highlights subtle changes in seismic character. Fig. 6 shows the instantaneous frequency attribute calculated from our data.
Each reflection in seismic data has an instantaneous frequency signature which is laterally distinguishable from other events.4 One such laterally distinguishable event is found at about 505 ms; this is a high-magnitude negative event that corresponds with the side-lobe of the Packer Shell reflector. In the region within the gas shadow, the event is suddenly interrupted and shifted to a much smaller magnitude. Underlying events at 530 ms and 555 ms have their characters suddenly changed as well. Other studies have discussed similar complex attributes as possible indicators of gas.4
Hydrocarbon indication
The three seismic attributes considered here-amplitude, average frequency, and instantaneous frequency-individually are not necessarily definite indicators of gas. Each case must be evaluated for alternative explanations for anomalous behavior or reflectors. In the area we investigated, there are good reasons to believe that reflectors immediately beneath the Clinton interval on our seismic data should be locally continuous, and indeed they are, with the exception already noted. The correlation of high initial production in the fully charged gas storage field demonstrates that the observed seismic anomalies are the result of a gas shadow from the Clinton interval reservoir.
The implications of this result touch on multiple facets of the local energy industry. Until recently, Ohio and indeed the eastern Paleozoic basins generally were considered "backwater" areas with limited investment in technology. But even with methods that are not 3D state of the art, useful information beyond structural and stratigraphic indirect indicators of hydrocarbon traps on 2D seismic data may exist. Examining vintage data with sufficient fold of coverage may be worthwhile in determining if gas shadows or other anomalies are evident for the Clinton interval and for other plays, such as the Trenton or the Rose Run. More subtle manifestations of the phenomena may be detected with more sophisticated methods that localize spectral content in time and space, such as matching pursuit or wavelet transform. The gas shadow effects relating to amplitude vs. offset (AVO) phenomena need to be examined. Sweet spot signatures may exist in unconventional reservoirs, such as the Utica and Marcellus shales.
Further developments should be anticipated cautiously. We observe a DHI associated with a Clinton interval gas storage reservoir in a fully charged state at pressures higher than in comparable natural reservoirs. But years of continuous cycling of natural gas through the reservoir may affect its character. Additional research is required.
Acknowledgments
The authors thank Precision Geophysical for seismic data acquisition, Seismic Earth Resources Technology for processing the data, CGG Veritas for donating the Hampson-Russell software license, and the Ohio Department of Natural Resources, Division of Geological Survey, for supplying well logs, support, and useful discussions.
References
1. Del Moro, Y., Davogustto, O., and Marfurt, K.J., "AVO Analysis for Lithology Prediction in the Pennsylvanian Reservoir Rocks in the Anadarko Basin, Oklahoma," American Association of Petroleum Geologists Convention and Exhibition, Apr. 22-25, 2012.
2. Bey, S., "Reservoir Characterization and Seismic Expression of the Clinton Interval over Dominion's Gabor Gas Storage Field in North-East Ohio," MS thesis, Wright State University, May 2012.
3. Haneberg-Diggs, D., "Seismic attributes of the Clinton interval reservoir in the Dominion East Ohio Gabor gas storage field near North Canton, Ohio," MS thesis, Wright State University, May 2014.
4. Tanner, M.T., Koehler, F., and Sheriff, R.E., "Complex seismic trace analysis," Geophysics, Vol. 44, No. 6, June 1979, pp. 1041-1063.
5. Ebrom, D., "The low-frequency gas shadow on seismic sections," The Leading Edge, Vol. 23, No. 8, August 2004, p. 772.
6. Castagna, J.P., Sun, S., and Siegfried, R.W., "Instantaneous spectral analysis: Detection of low-frequency shadows associated with hydrocarbons," The Leading Edge, Vol. 22, No. 2, February 2003, pp. 120-127.
The Authors
Dominique M. Haneberg-Diggs ([email protected]) is a geologist at the Ohio Department of Natural Resources, Division of Geological Survey. He holds an MS in earth and environmental sciences from Wright State University, Dayton, Ohio, and a BS with honors in geology from the University of Cincinnati. He is a member of the Society of Exploration Geophysicists (SEG), American Association of Petroleum Geologists (AAPG), and the Geological Society of America (GSA).
Scott Bey ([email protected]) is a geophysicist at Chesapeake Energy Corp. He holds a BS (2010) and MS (2012) in earth and environmental science from Wright State University. He is a member of the SEG and the Geophysical Society of Oklahoma City.
Doyle R. Watts ([email protected]) is associate professor of geophysics at Wright State University. He is a member of the SEG, AAPG, American Geophysical Union, Ohio Geological Society, and the European Association of Geoscientists and Engineers.
Ernest C. Hauser ([email protected]) is associate professor of Geophysics at Wright State University. He earned a PhD at the University of Wisconsin, Madison, in 1982, and worked for 13 years at Cornell University before arriving at Wright State. He is a member of the AAPG, SEG, and the Ohio Academy of Science.
Thomas F. McGovern ([email protected]) is owner and processing manager at Seismic Earth Resources Technology LLC, Castle Rock, Colo. He has also served as vice president and processing manager at Lauren Geophysical, 3D research analyst at Strata Search, and as senior seismic analyst, Raytheon Seismic Services Corp. He holds a BS in geology from Temple University, Philadelphia, and an MS is geophysics from the Colorado School of Mines, Golden, Colo.
Steven L. McCrossin ([email protected]) has served as president of Precision Geophysical Inc. for the past 25 years. Before this he started his career Raytheon's Seismic Services Corp. Steve is a member of SEG, the Ohio Oil and Gas Association, New York Oil and Gas Association, Pennsylvania Oil and Gas Association, and the West Virginia Oil and Gas Association.
