SPECIAL REPORT: Integrating surface seismic velocity into subsurface interpretation in the gulf
The critical role played by accurate seismic velocity measurements in imaging is well documented. Optimal summing of prestack time migrated (PSTM) data depends on accurate seismic velocity measurements, and the PSTM image quality is degraded when suboptimal velocity measurements are used in stacking the data.
Seismic interval velocity models are needed for prestack depth migration (PSDM), and substandard velocity models yield substandard depth images. In both processing strategies, flat offset gathers are used to gauge the validity of the velocity used.
Seismic velocities are also used to generate pore pressure and stress volumes for well planning and subsurface interpretation. Accurate PSTM velocity measurements and PSDM models, calibrated to wells, are critical to success in these areas.
Examples of costly well failures traced to incorrect velocity measurements can be found in the literature, though they are not numerous. Preventable, costly failures caused by errors in velocity are preferably forgotten, rather than documented.
In this article we discuss the use of seismic velocity trends in subsurface interpretation. Specifically, we discuss measuring accurate velocity trends for lithology prediction and examine time and depth velocity trends near hydrocarbon accumulations. We use data examples to illustrate the effects of sampling and smoothing of subsurface velocity information in preserving valid trends. Finally, we illustrate the impact of oversmoothing of the velocity trends on the interpretation of subsurface depth structures.
Time migration seismic velocities discussed in this article are measured using the standard semblance method. These velocities are the maximum coherency seismic velocities from which interval velocities are computed using the well known Dix formulation.1
Our semblance measurements are sampled densely, 300 ft by 300 ft by 100 milliseconds, unless otherwise noted. Depth models are generated from interval velocities obtained from travel time tomography measurements; however, these velocities are more coarsely sampled and smoothed than the PSTM seismic velocities.
Revealing lithology
In the following examples from the deepwater Gulf of Mexico, the data are processed through standard time migration templates, but processing velocities were chosen from tightly sampled semblance measurements made with an auto volume picker. In many standard templates, semblances are often sampled coarsely and then smoothed, resulting in a loss of valid information and resolution. Consequently, the information illustrated in the following examples is often unavailable to the interpreter.
It is important to note that the choice of sampling interval dictates subsurface sampling and is in itself a smoothing process.
Direct detection
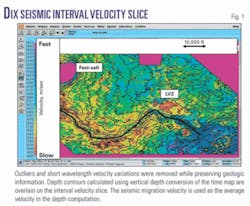
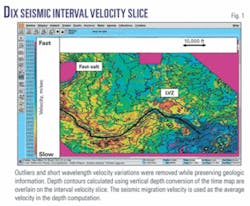
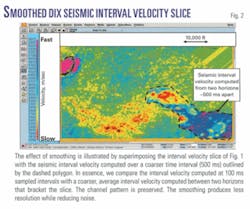
Velocity measurements may be mapped and the mapped features correlated directly to lithologic features. As in any mapping, the degree of confidence in the features and associated correlation will depend on the density of the mapped data set. The first example is a channel feature about 3,000 ft below the mud line. The channel is easily recognized using seismic interval velocities (Figs. 1 and 2).
Fig. 1 shows an interval velocity slice calculated from high density maximum coherency seismic velocities displayed in color; the darker colors represent faster velocities. Depth contours generated from vertical depth conversion using a time map of the channel and the PSTM seismic velocities are superimposed on the interval velocity slice. The fast feature in the upper left corresponds to a salt body. Also note the low velocity zone (labeled LVZ) that pulls up the time contours when converted to depth.
Fig. 2 illustrates the effect produced by smoothing a portion of the interval velocity slice outlined by the dashed polygon. The objective of smoothing is to reduce noise while preserving resolution.
Interpretation with time profiles
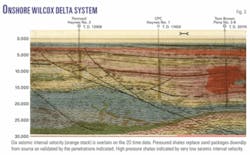
We begin with a 2D data example from the Wilcox delta system in onshore Texas.
We use the Dix interval velocity trend to interpret lithology changes in a time profile (see Fig. 3). Seismic velocities from semblances were analyzed by an interpreter at 2,000-ft intervals. Faster velocity packages, indicated by the yellowish color, are found closer to the growth fault and are correlated with sand deposits, as opposed to slower background shales. The faster sands are replaced by low velocity, high pressure shales away from the fault. Wells confirmed the correlation of faster seismic interval velocity sand packages decreasing away from the source.
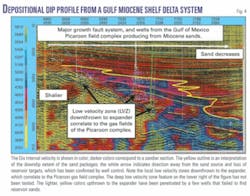
The next example from the Miocene delta trend in the shelf area of the US Gulf of Mexico further illustrates the above concept: seismic interval velocities can be used to detect the extent of sands. Fig. 4 is a dip profile from a 3D data set showing the Miocene growth fault, with the colored interval velocity overlaid. The faster velocity regions, correlated with sand pulses, die out away from the sand source (upthrown to the growth fault). Note the low velocity zones downthrown to the major expander, associated with the prolific Picaroon gas field complex.
The interpreted seismic velocity measurements were made using a high density, 300 ft by 300 ft by 100 ms grid, on prestack time migrated data. Outliers were removed after the Dix interval velocity was computed, and a 2,500-ft box filter was used to smooth the interval velocity. This processing preserves the trends, i.e., fast velocity “sand pulses” diminishing away from the delta source. Note the similarity between the Miocene delta interpretation of Fig. 4 with that of the onshore Wilcox system of Fig. 3 (2D data with velocities sampled every 2,000 ft, and validated by well control along the deposition direction).
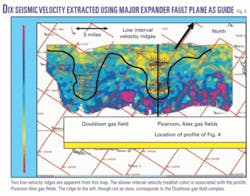
To further elucidate the concept, the Dix interval velocity was extracted adjacent to the expander fault plane and is displayed in map view in Fig. 5. Note the yellow colored low velocity zones penetrated by wells. The hydrocarbon bearing zones line up along low velocity ridges that correlate to the fields shown in the illustration. The ridge to the left is associated with the Doubloon gas fields (not shown in profile), while the slower ridge to the right is associated with the Picaroon fields of the profile illustrated in Fig. 4. For reference, the profile of Fig. 4 is highlighted on the map of Fig. 5.
From Fig. 5, a correlation between seismic interval velocity “slow zones” and hydrocarbon pays can be made. This correlation will be further examined in the next section where we compare time and depth velocity trends in a deepwater Gulf of Mexico oil field.
Velocity trends compared
The previous section demonstrated the use of seismic velocity trends for direct detection of lithologic information or extraction of lithologic information by integration of velocity data and prestack time migrated data. In this section we compare PSTM and PSDM velocity trends. Generally, PSDM velocities are smoother and sampled on a coarser grid than the 300 ft by 300 ft by 100 ms grid typically used for our PSTM measurements.
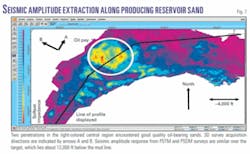
The area of investigation is a deepwater field in the Gulf of Mexico; a salt rimmed minibasin with calibration provided by well control in oil bearing Pliocene-Miocene age sands. Our discussion focuses on seismic velocity measurements in the sedimentary portion of the basin, although the approach may be extended under “well-behaved” salt. Two substantially orthogonal 8,000-m cable 3D surveys were acquired over the field and are the source of the data. It is important to note that the surveys were processed in time and depth and that the velocity trends for each survey were derived independently of one another. The surveys will be labeled A and B, and acquisition directions are indicated in the map display of Fig. 7.
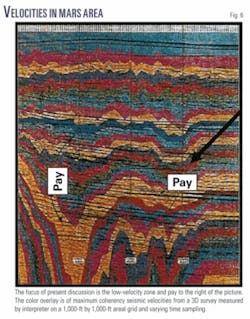
Fig. 6 shows a profile through the field with a color overlay of the maximum coherency prestack time migration velocities. Note the low velocity zone to the right of the figure which is the focus of our discussion. The low velocity zone to the left correlates to multiple pay horizons in the field, and has been previously discussed in this journal.2
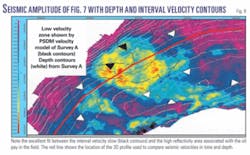
Fig. 7 shows the seismic amplitude extraction along the target horizon which encountered 100 ft of oil pay tested by two wells. The seismic profiles that will be analyzed follow a depth contour highlighted in the figure. The amplitude extraction is from survey A.
Fig. 8 zooms in on the amplitude map of Fig. 7 with PSDM depth contours (in white) from survey A superimposed. Note that the depth contours and the seismic amplitude strength outline do not correlate, interpreted as a strong stratigraphic component to the accumulation. Also superimposed on the amplitude map are the seismic interval velocity contours (in black) used to depth migrate survey A. Note the excellent fit between the low velocity seismic interval velocity contours and the high reflectivity pay zone.
We next examine the low velocity trends over the pay area using time and depth profiles from both surveys. The profile chosen follows a depth contour so the horizon is nearly flat in the depth images. The corresponding seismic interval velocity, PSTM or PSDM, will be overlaid on the respective profiles from both surveys. The absolute scale values for these figures differ; however, our focus is the velocity trend near the pay horizon.
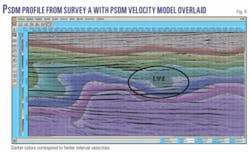
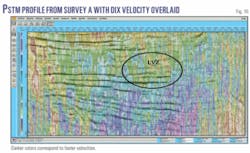
The PSDM profile from survey A is shown on Fig. 9 with the PSDM interval velocities overlaid in color. The comparable PSTM profile from survey A is shown in Fig. 10, with the PSTM Dix interval velocity in color. Both time and depth velocities indicate a low seismic interval velocity zone near the pay. The PSTM Dix interval velocities are more densely sampled and have little smoothing and hence are noisier than the PSDM velocities, but the low velocity zone is still present in these hands-off semblance based measurements.
The low velocity zone that accompanies the strong amplitude response of the producing reservoir is highlighted with the ellipse; the PSDM interval velocity cuts across the white depth contours of Fig. 8. The low velocity zone on the left is associated with other field pays and is not the subject of the present discussion. The interval velocity trend has not been discarded by undersampling and oversmoothing when building the depth migration velocity model of survey A.
Fig. 10 is the same profile extracted from the 3D PSTM volume of survey A; high density, semblance based, seismic velocity measurements were used to compute the Dix interval velocity, shown in color. The PSTM velocity measurements have little smoothing, and the noise is apparent. The low velocity trend is preserved in the time-based processing, serving as quality control for the PSDM velocity model. The presence of very different trends between the time and depth processes serves as a powerful diagnostic. The PSTM and PSDM trends are related; if valid PSTM velocity trends are not preserved in the depth model because of improper sampling or oversmoothing, the depth model will result in poor image quality or invalid pore pressure prediction, if the latter is based on the overly smoothed depth velocity model.
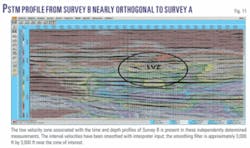
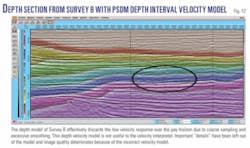
Figs. 11 and 12 show comparable PSTM and PSDM profiles taken from survey B. Note that for survey B, the PSTM seismic interval velocity trends, derived from densely sampled semblances, retain the low velocity zone in the high amplitude area of pay (Fig. 11). However, the low velocity region is not present in the PSDM velocity model used in survey B (Fig. 12). A comparison of Figs. 9 and 12 indicates that the smoothed velocities used in survey B’s PSDM also produces a poorer, less crisp depth image of the producing horizon from that obtained from survey A.
The gridded PSTM maximum coherency seismic velocity measurements from both surveys were compared near the level of the pay horizon. Although not displayed, this difference is about 50 m/sec between surveys A and B in the sedimentary basin; larger variations are reflected by measurements in and around salt. However, the difference is nearly uniform over the area of interest; the PSTM seismic velocity trends are similar and the low velocity zone near the pay is recorded by both surveys.
This example demonstrates the need to carefully consider the sampling and smoothing operators used in constructing the PSDM velocity model. The failure to preserve the low velocity zone in survey B’s PSDM velocity model is attributed to undersampling or oversmoothing, and such errors adversely impact subsurface interpretation. Although the depth contours are not significantly affected in this case, the omission of the low velocity zone near the pay horizon can be a detail important to the interpreter attempting to integrate seismic velocities into evaluation of the subsurface.
The example also demonstrates the possible use of seismic time-migrated velocity measurements for quality control by the geophysical processor and subsurface interpreter prior to implementing the more resource intensive depth migration process. The quality of semblance measurements depends on data conditioning; we would have obtained better results if the processing workflow had been optimized to make the best semblance measurements. Comparison of the unbiased time migration measurements between orthogonal surveys was a goal secondary to our PSDM effort; we routinely skip the time processing and associated velocity measurements as a matter of expediency.
This is the first of a two part article on greater use of seismic velocity in subsurface interpretation in the Gulf of Mexico. Next week: Smoothing of seismic velocity trends.
