Rest of world continues to gain ground on Canada, US
These surveys are in PDF format and will open in a new window
- Click here to view the Worldwide Gas Processing survey.
- Click here to view the World Sulphur Production survey.
With worldwide natural gas production flat at the end of 2002, it's no surprise that the world's gas processing capacity showed virtually no growth last year.
Gas production in 2002 (OGJ, Mar. 10, 2003, p. 70) increased less than 1% over production in 2001 (OGJ, Mar. 11, 2002, p. 86). Likewise, worldwide gas processing capacity in 2002 increased slightly more than 1%, according to the latest Oil & Gas Journal's data that also reflect upward corrections based on new information. Capacity in North America, which historically leads the world, increased less than 2%.
With the apparent resolution of Iraq's situation and growing signs the world's major economies may be recovering from recession, natural gas demand has been strong and should push up 2003 production, which will in turn increase pressure for more processing capacity.
In the US, strong demand is behind most predictions of a 30-tcf market as early as 2010 with only some of the increased supplies coming from new Canadian, US, or Mexican production. This situation has made LNG as attractive a supply option as has been seen since the 1970s (OGJ, June 23, 2003, p. 72) and augurs for more processing capacity in those areas outside the US that figure to be major suppliers to its markets.
As European economies improve, more gas will also find markets there, especially to address environmental concerns. Increased supplies by pipeline from Russia and the Caspian Sea region along with LNG imports from the Middle East and Africa will require additional processing capacities in those production areas.
The future for gas processing outside North America looks bright, provided of course improving economies support increased gas demand.
Reduced dominance
Such capacity increases outside North America will further a trend identified earlier in these annual reports: The historical gas processing dominance of North America, especially the US, is waning.
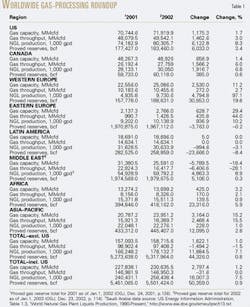
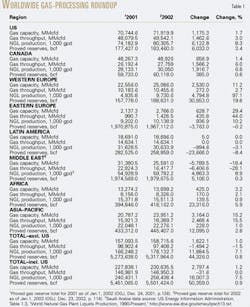
In 2002, the US and Canada held slightly more than 52% of the world's gas processing capacity and produced more than 42% of the world's NGL (Table 1). Those levels are virtually even with capacity and production for 2001 reported last year (OGJ, June 24, 2002, p. 50). Pulling Mexico from the Latin America column and adding its figures to those for Canada and the US reveal that North America holds:
- More than 54% of the world's processing capacity, down from more than 55% for 2001.
- As much as 48% of its NGL production, down from nearly 52% for 2001.
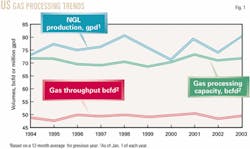
On Jan. 1, 2003, US gas processing capacity stood at nearly 72 bcfd; throughput in 2002 averaged more than 49.5 bcfd; and NGL production, more than 80 million gpd (more than 1.9 million b/d; Fig. 1).
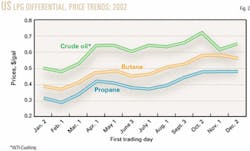
Fig. 2 shows pricing differentials in the US between LPG—the most widely traded NGL—and crude oil for the first trading day of each month in 2002. The chart shows that the historically normal relationship between LPG and crude oil that prevailed in late 2001was continued throughout 2002.
A 2002-03 winter colder in North America than recent winters and continued concerns about the world's crude oil inventories steadily pushed prices up well into early 2003 where they were roiled even further by the US and British invasion of Iraq.
Prices in second quarter 2003 were settling into a steadier range as the world's economies began to digest consistently better economic news.
Canadian gas processing capacity as 2003 began stood at slightly less than 49 bcfd with an average of more than 27 bcfd going through the country's plants. NGL production showed considerable gain over that for 2001at more than 30million gpd.
As stated, however, North American dominance over the rest of the processing world in capacity showed clear signs of lessening in 2002 as OGJ data continued to find more processing capacity growth outside North America.
As stated, capacity in the US and Canada in 2002 declined in 2002 as a percentage of world capacity. The two countries produced slightly less than 43% of the world's NGL, compared with nearly 45% in 2001.
Outside North America, new, corrected OGJ figures for Malaysia along with new capacity in Norway and expanded capacity in Saudi Arabia lead to a clearer picture of how the world's gas processing is evening out between Western and Eastern Hemispheres.
OGJ's survey revealed that total capacity outside the US for 2002 stood at nearly 69% of the world's, an increase of 1.6 bcfd. NGL production outside the US increased more than 7% almost to reach 69% of the world's total.
Sources; the world
All gas processing activity figures in the breakout tables (available to subscribers at www.ogjonline.com) are based on Oil & Gas Journal's exclusive, plant-by-plant, worldwide gas processing survey and its international survey of petroleum-derived sulfur recovery.
Canadian data are based on information from Alberta's Energy and Utilities Board (AEUB) that reflect actual figures for gas that moved through the province's plants and are reported monthly to the AEUB. For 2000 for the first time, OGJ took these data for all of Alberta and compiled annual figures and thereby created a new baseline for data comparisons thenceforth.
In addition to AEUB figures for Alberta and to operator responses to its annual survey, OGJ has supplemented its Canadian data with information from the British Columbia Ministry of Employment & Investment's Engineering and Operations Branch and the Saskatchewan Ministry of Energy & Mines.
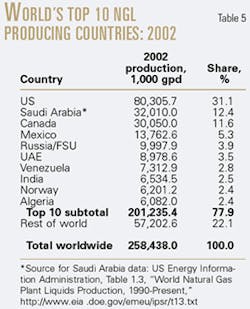
NGL production data for Saudi Arabia, the world's second largest NGL-producing country and the world's largest exporter of LPG, are an aggregate published by the US Energy Information Administration.
The kingdom is in the middle of an extensive plan to develop is own petrochemical industry and to supply that industry with domestically produced feedstocks. As a result, in 2002 it commissioned the 1.6-bcfd Hawiyah plant, the first to process nonassociated gas. Later this year, Saudi Aramco will commission the Haradh plant, a twin of the Hawiyah gas plant.
Expansions were completed last year at the Berri plant, to 1,150 bcfd from 870 bcfd; at Shedgum, to 2.4 bcfd from 2.1; and at Uthmaniyah, to 2.5 bcfd from 2.1 bcfd.
New OGJ data have also led to corrections in data for Iran (-5.4 bcfd) and Malaysia (+3 bcfd).
At the start of 2003 outside Canada and the US, gas processing capacity stood at slightly less that 110 bcfd; throughput for 2002 averaged more than 69.6 bcfd; and NGL production averaged more than 148 million gpd.
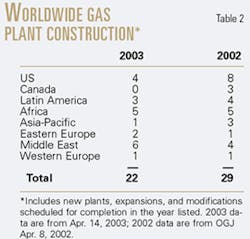
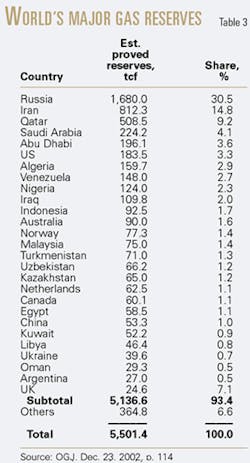
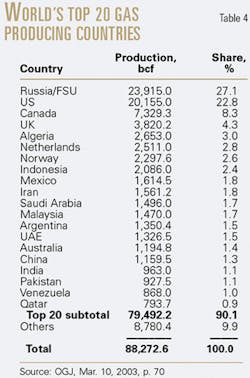
Table 2 provides a snapshot of the current state of gas plant construction in the world. Table 3 ranks the world's major natural-gas reserves by country at the start of 2002; Table 4, the world's top natural-gas producing countries for 2001; and Table 5, the world's leading NGL producers.
In petroleum-derived sulfur recovery, worldwide production refining and natural gas processing hit nearly 81.5 million tonnes/day from slightly more than 172 million in capacity.
Canada and the US continued to dominate the world in 2002, holding more than 46% of processing capacity and almost 48% of actual production. Canada produced nearly 22 million tonnes/day, an increase over its 2001 production. The US produced almost 18 million tonnes/day, a considerable increase over its 2001 production of 15.8 million tonnes/day.
Canada accounted for more than 22% of the overall total capacity; the US, more than 23%.
