Big jump in ultimate recovery would ease, not reverse, postpeak production decline
Big jump in ultimate recovery would ease, not reverse, postpeak production decline
Historic data show that more than half of the world's oil-producing nations are past their production peak.
Our forecasts indicate that a large increase in the estimated ultimate recovery (EUR) would delay a global peak in oil production, or Peak Oil, by only a few years; however, it could significantly reduce the postpeak rate of production decline.
In addition, incremental oil production data show that Peak Oil could occur with little or no warning, and the lack of spare production capacity and fewer new discoveries preclude a 1980s-style recovery.
Thus, the Organization of Petroleum Exporting Countries soon may lose its ability to maintain an oil price band.
The database used for this analysis comprises the top 45 oil-producing nations that accounted for 98.7% of world oil production in 2003.1
Most nations past peak
A nation was automatically classified as past peak if 1) its maximum oil production occurred more than 5 years ago or 2) its maximum production occurred more recently, and our forecasts indicate that it is past peak.
In the list of past-peak nations, 18 were automatically classified as past peak and 7 more were forecast to be past peak, giving a total of 25 (56%) of the top 45 nations as past peak.
It is worth mention that none of the 45 nations peaked from the 1860s through the 1960s. Then suddenly 10 nations peaked in the 1970s—led by the US, Libya, and Venezuela, each in 1970. Next, 5 more peaked in the 1980s, 7 in the 1990s, and 3 already in the 2000s. Thus, from 1969 through 2003, the number of past-peak nations grew from 0 to 25, an addition of about 1 nation/year.
Out of the 11 OPEC nations, 6 peaked in the 1970s and 1 more in the 1980s. Hence, 64% of the 11 OPEC nations are classified as past peak. Further, the top three oil-producing nations of the world are past peak: the US (1970), Saudi Arabia (1980), and Russia (1987). For instance, Saudi Arabia's oil production averaged 9.95 million b/d in 1980 and 8.9 million b/d in 2003, down 10.6% from its historic high.2
Tracking the number of nations that are past peak is a work in pro- gress. For example, if a nation that is now listed as past peak reaches a future and higher level of production, then it is removed from the list, and the studies continue.
According to Douglas-Westwood Ltd., Canterbury, UK, "Although 99 countries have or can produce significant volumes of oil, 52 are already well past their peak, including the US, and this is now happening in several more, including the UK. Another 16 [including Australia and China] are at peak or will reach it soon. UOnce a country is past peak production, there is a negligible chance that it will be able to reverse its long-term decline."3
Peak Oil delayed
All world oil forecasts are speculative, whether they predict Peak Oil as near or far.
To date, eight forecasts of world oil production have been made wherein each forecast predicted 1) the year that oil production would peak, 2) the rate of postpeak production decline, and 3) the magnitude of the EUR.
Forecast No. 2, for instance, was obtained by making separate forecasts of the world's top oil-producing nations that, combined, accounted for 98% of world oil production in 1996. It predicted that 1) Peak Oil would occur in 2007, 2) postpeak production would decline at 2.8%/year, and 3) the world EUR would be about 2 trillion bbl.4
In addition, the recently completed special forecast, "Forecast X," began with the assumption that world EUR would be 3.3 trillion bbl and then forecasted how this larger resource would delay the world peak and affect the postpeak rate of production decline. To wit, Forecast X projected that 1) world oil production would peak in 2010, and that 2) postpeak production would decline at a rate of 1.3%/year.5
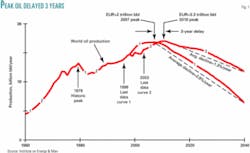
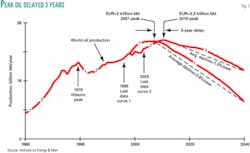
The effects of adding 1.3 trillion bbl to the world EUR are demonstrated by overlaying the production curve from Forecast X with that from Forecast No. 2 (Fig. 1).
Forecast No. 2 (Curve 1) shows historic data from 1960 to 1996 and our forecast from 1997 to 2040. In contrast, Forecast X (Curve 2) shows historic data from 1960 through 2003 and the projection from 2004 to 2040.
Main findings
Increasing the EUR by 1.3 trillion bbl delays Peak Oil by 3 years, or about 1 day/1 billion bbl added to the EUR.
The larger EUR also decreases the postpeak production decline by more than half.
With an EUR of 2 trillion bbl, Peak Oil occurs when 57% of the EUR has been produced; with an EUR of 3.3 trillion bbl, the world peak occurs when 37% has been produced.
According to Colin Campbell and Jack Zagar in their paper written for a special panel on Peak Oil at the Offshore Technology Conference in Houston this year, "Production of gas, NGLs, and nonconventional deepwater [oil], heavy oil, and polar oil will expand, but they will lessen the decline and shift the peak by only a few years."6
IOP instructs
Incremental oil production (IOP), completes the trilogy of measures needed to describe the world oil situation and helps forecast and understand oil production trends. Namely, IOP specifies the year-on-year change in oil production, p specifies oil production, and Q cumulative oil production.
For example, IOP shows how fast the oil industry can, or is willing to, respond to rapid surges in the demand for oil. Another example is that, when graphed, rapid changes in IOP are much more visible than the corresponding changes in p, and vastly more visible than those in Q. Thus, IOP data can be mined for unique and useful information.
Principles
Incremental oil production is the difference quotient of oil production with respect to time: IOPi = DPi/Dt. On an annual basis, it can be determined in two easy steps: 1) obtain the world oil production data; 2) calculate the year-on-year changes in oil production: DPi = (Pi – Pi–1). t is automatically 1 year. If IOP is positive, then oil production increased; if it is negative, then production decreased; if it is zero, then production remained the same.
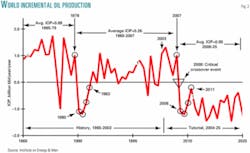
The vertical axis for IOP is scaled in billion bbl/year/year (bbl/y/y), and yearend balances are plotted (Fig. 2).
Historic world IOP data are shown from 1965 through 2003 and tutorial values from 2004 through 2025. The tutorial is hypothetical.
Based on moving averages, IOP is positive from 1965 through 2007 and negative from 2008 through 2025. In detail, IOP averages a strong 0.89 billion bbl/y/y from 1965 through 1979; then it declines to a modest 0.26 billion bbl/y/y from 1980 through 2007; finally, it plunges negative to minus 0.95 billion bbl/y/y from 2008 through 2025 (Fig. 2).
The critical crossover event (CCE) is defined as the point in time when IOP goes from a positive value to a negative value and then, on average, remains negative permanently. Whether it is imminent or remote, the CCE is bound to be an important milestone in the world oil life cycle. In the tutorial, the CCE occurs in 2008, as marked by the down-pointing triangle.
The similarities and differences in IOP during the historic period and the tutorial period are key to understanding Peak Oil. First, IOP is positive, on average, well before both the historic year 1979 and the tutorial year 2007. Second, the five historic values of IOP from 1979 to 1983 (circled in Fig. 2) are duplicated in the five tutorial values from 2007 to 2011 (also circled in Fig. 2). Third, and decisively, the historic IOP from 1984 to 2003 is positive, but the tutorial IOP from 2012 to 2025 is negative.
The five circled points of IOP in the historic period (1979-83) were duplicated in the tutorial period (2007-11) to prove that a sudden plunge in IOP has a historic precedent (Fig. 2). In other words, the shape of the hypothetical oil production peak in 2007 was purposely constructed to match the historic peak in 1979 (Fig. 3).
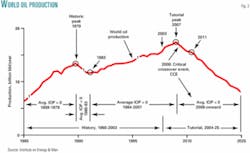
Historic world oil production data are shown from 1965 through 2003 and tutorial values from 2004 through 2025. As we shall see, oil production and IOP go hand in glove.
The years 1979 and 2007 are again circled in Fig. 3, but now they depict the historic and tutorial peaks, respectively, of world oil production. Each of these peaks can be readily understood in terms of its sequence of IOP.
A long-term positive IOP concludes with the historic peak in 1979. This is followed by a short, steep period of negative IOP from 1980 through 1983, and then another long period of positive IOP from 1984 through 2003. The clue to the historic production peak and the production recovery in the 1980s and 1990s is the positive-negative-positive sequence of IOP. Namely, new oil coming online from the many non-OPEC nations in South America, Europe, Africa, and the Asia-Pacific region explain the recovery of world oil production from 1984 through 2003.
Likewise, a long period of positive IOP concludes with the tutorial peak in 2007. But, crucially, that period is followed by a permanent period of negative IOP from 2008 onwards. In different words, the giveaway clue here is the occurrence of the CCE in 2008: the positive-to-negative plunge of IOP immediately after the tutorial peak. Significantly, oil production continues to decline from 2008 onward because the world's spare production capacity has been taken up by rising demand and new oil discoveries are lacking. Once all the taps are wide open, then geology constrains production.
Supply-demand imbalance
Global oil demand in 2004 is projected to be 2.31 million b/d more than it was in 2003. About 1.11 million b/d of that is expected to come from OPEC. Excluding Iraq, that amounts to 67% of OPEC's spare capacity.7 Thus, if a similar surge of global demand should occur in, say, 2005 or 2006, then OPEC could lose control of maintaining its low-to-high band of world oil prices.
Douglas-Westwood's Michael R. Smith observed, "Oil reserves are depleting, and demand [is] growing. Recent increases in oil demand from the developing world are likely to accelerate. [Douglas-Westwood's] World Oil Supplies Report shows that any growth in global economic activity increases oil demand such that, at 1%[/year] demand growth, a production peak occurs in 2016; at 2%, it occurs in 2012, and at 3% it occurs in 2008."3
Writing in the New York Times, Alex Berenson noted, "Rising demand and the drop in production at the supermajors offers more evidence that energy prices may stay high for the foreseeable future. The data are starting to say that underlying all this, the supply-demand balance is tighter than we thought. The maturing geological base is starting to rear its ugly head."8
Summing up
Out of the world's top 45 oil-producing nations, 25 (56%) are now past their peak rate of production, including 7 (64%) of the 11 OPEC nations.
Increasing the global EUR to 3.3 trillion bbl from 2 trillion bbl delays Peak Oil by 3 years, or about 1 day for every billion bbl added to the EUR. The larger EUR could, however, change an otherwise sharp production peak into an extended production plateau.
Comparing IOP data directly, year for year, with oil production data brought forth useful new information.
For example, the important difference between future years and the 1980s-90s is that there is now neither the spare capacity nor the new discoveries needed to reverse an abiding decline in world oil production.
The CCE will be the first indicator to confirm that Peak Oil has passed. If strong surges in oil demand persist, then OPEC will no longer be able to maintain an oil price band within prescribed limits.
References
1. BP Statistical Review of World Energy, BP PLC, 1965-2004, www.bp.com.
2. Al-Husseini, Sadad, "Rebutting the critics: Saudi Arabia's oil reserves, production practices ensure its cornerstone role in future oil supply," OGJ, May 17, 2004, p. 16.
3. Smith, Michael R., Douglas-Westwood Ltd., e-letter, May 2004, adm@ dw-1.com.
4. Duncan, R.C., and Youngquist, W., "Encircling the Peak of World Oil Production," Natural Resources Research, Vol. 8, No. 3, 1999, pp. 219-232.
5. Duncan, R.C., "World Oil Forecast X," Institute on Energy & Man, Seattle, Apr. 1, 2004.
6. Zagar, J., and Campbell, C.J., "The Iron Grip of Depletion," Offshore Technology Conference, OTC 16863, www.otcnet.org/2004.
7. International Energy Agency, Oil Market Report, June 10, 2004, www.oilmarketreport.org.
8. Berenson, A., "An Oil Enigma: Production Falls Even as Reserves Rise," New York Times, June 12, 2004, www.nytimes.com.
This is the second in a series of four articles revisiting the debate over Hubbert's Peak.
The author
Richard C. Duncan ([email protected]) is director of the Institute on Energy & Man that he founded in 1993. He has worked at Boeing Co. and Puget Sound Energy Co. in Washington. From 1985 to 1992, Duncan worked as a power control specialist at Saudi Consolidated Electric Co. in Dammam, Saudi Arabia. He also has taught engineering courses at the university level. Duncan received an MS in electrical engineering and a PhD in systems engineering, both from the University of Washington, Seattle.


