Fines control increases gas production
A surface-modification additive (SMA) to the proppant in a fracture-stimulation treatment increased the gas production rate and prolonged the life of a gas well in Saudi Arabia.
This additive stops fines from invading the proppant pack inside the fracture, so that the well maintains its conductivity under severe conditions of high temperatures and high production flow rates.1
The well produces from highly permeable and unconsolidated pay intervals in the Unayzah sandstone formation.
These intervals, even with a minimum drawdown, typically produce formation sand.
Treatment results
In the well, two minifracs performed before the main frac indicated unrestricted fracture height growth. Therefore, the plan for the main frac included a small proppant load of 50,000 lb, with a 100-ft frac length goal.
This design was expected to result in an average 5,000 md-ft conductivity, but post-treatment analysis showed that the treatment achieved a 66-ft frac length and an average 7,055 md-ft conductivity.
The analysis also indicated that the created fracture avoided the wet zone below the pay. Post-frac testing of the well confirmed this conclusion.
The well initially produced 40 MMscfd with little drawdown. Also no sand production was evident during the first 90 days of production.
Area wells stimulated with untreated proppant may produce at comparable rates, but typically the wells begin producing sand within a few weeks, thereby decreasing the gas production rate.
The reservoir accessed by the well has a kh (permeability x height) value comparable to other wells in the field.
Other parameters for the well are:
- 20-ft perforated interval.
- 3.8-15.7% porosity range.
- ±265° F. formation temperature.
- ±8,600 psi reservoir pressure.
Other wells in the area, completed in more ideal reservoirs and stimulated with larger proppant loads, have higher drawdown pressures and require lower production rates to produce sand-free. Post-frac buildup analysis in these wells indicates that they have high fracture conductivity, although skins range from 150 to 300.
In addition to non-Darcy flow effects, formation sand and fines are believed to contribute strongly to this high skin damage.
SMA
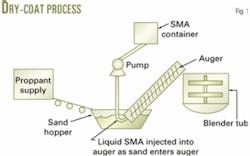
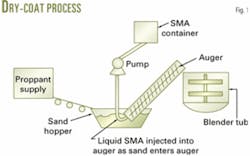
SMA is a polymer resin applied to proppant in a dry-coat process (Fig. 1). The process involves pumping the resin to the bottom of a sand screw where auger action helps spread and coat the resin onto the proppant.
Then, the sand screw delivers the SMA-coated proppant to the blender that blends the proppant with the fracture fluid before the fluid is pumped downhole.
A thin coat of SMA clings to the proppant surfaces, imparting a tacky or slightly sticky feel to the proppant. The coated proppant grains in the outside of the proppant pack, such as at the formation-proppant interface, fix in place the fine particles migrating through the proppant pack.
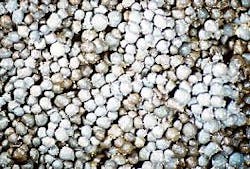
Fig. 2 illustrates the migration of the fine particles, the white particles in the photo on the left, through a pack of ceramic proppant. The flow is right to left in both photos. The fines tend to gather in tight pore spaces and eventually plug or reduce the conductivity of the proppant pack.
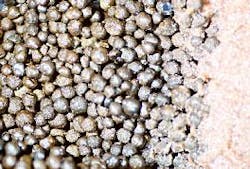
In the photo on the right (Fig. 2), the proppant pack has been treated with SMA. The tan-colored area at the right is Brazos River (Texas) sand that simulates a formation containing fines. The fines have gathered in the right side of the proppant pack.
The complete proppant pack, treated with SMA, has fixed in the interface area the migrating fines. Flowing water beaded up on the proppant gives the illusion of white particles similar to the fines seen in the left photo. But no fine particles have migrated past the interface area in the right one third of the photo.
Test results
Halliburton submitted SMA samples to a major independent testing laboratory to determine an unbiased evaluation of the additives performance for preventing fines migration.
The test laboratory ran extensive tests with SMA, resin precoated proppant (RCP), ceramic proppant, unconsolidated-simulated formation sand, and sandstones.
It used proppants with 20/40 and 16/30 mesh sizes and conducted tests at 250 and 325° F. with stress cycling under simulated gas flow rates between 50 and 100 MMscfd.
The accompanying box lists test parameters for measuring the amounts of migrating fine particles collected from flowing liquid through test cores. It also outlines the test procedure for measuring conductivity of the test media after the media was subjected to high temperature, high gas-flow rates, and stress cycles.
Measurements were taken after 1 day of flow and after 5 days of flow.
null
null
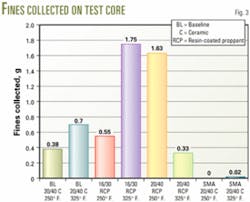
Fig. 3 compares fines collected from baseline cores of 20/40 ceramic proppant, 16/30 and 20/40 resin precoated proppant (RCP), and SMA-treated 20/40 ceramic proppant. All tests were performed at 250 and 325° F.
In Fig. 3 from left to right, the first baseline bar (yellow) is an untreated, synthetic, high-strength proppant tested at 250° F. The second baseline bar (purple) represents fines collected from the same proppant conditions, but at 325° F.
The resin precoated proppants and the SMA-treated proppants tested were all high-strength ceramics.
Dramatic differences in fines-migration performance are evident in Fig. 3. The SMA-treated proppant bed allowed no measurable fines migration at 250° F., while at 325° F., it allowed 0.02 g.
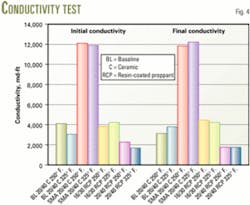
Fig. 4 illustrates proppant-pack conductivity after flow periods of 1 day (initial conductivity) and 5 days (final conductivity).
The conductivity test used samples of the same proppants as in the fines-collection test (Fig. 3). Test temperatures were also the same 250 and 325° F.
Results shown in Fig. 4 demonstrate the effectiveness of using coating proppants with SMA to control fines migration within proppant packs.
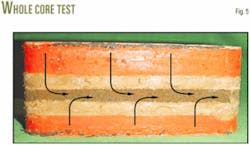
Fig. 5 shows the test core after it was frozen and removed from the test cell. The physical action of forcing the core-proppant sandwich from the test cell caused fines to slide down the side and onto the proppant fracture.
The proppant pack is sandwiched between the unconsolidated Brazos sand packs.2
This configuration represents the worst scenario in which formation sand or fines migrate freely or become embedded into the proppant pack.
SMA-coated proppant stopped the fines at the proppant-formation interface and minimized the effects of proppant embedment.
It was observed that the fracture width of proppant pack that had been treated with SMA remains constant during flow.
In contrast, total fracture width is reduced significantly for the uncoated proppant and those with RCP.
This represents embedment and penetration of formation material into the pack.
In summary, for soft or unconsolidated formations, tests show that SMA-treated proppant prevents formation fines from extruding or migrating into the proppant pack. As a result, the proppant pack maintains better conductivity than with the uncoated and RCP materials in the tests. F
References
1. Solares, J.R., Bartko K.M., and Habbtar, A.H., "Pushing the Envelope: Successful Hydraulic Fracturing for Sand Control Strategy in High Gas Rate Screenless Completions in the Jauf Reservoir, Saudi Arabia," SPE International Symposium and Exhibition on Formation Damage Control, Lafayette, La, Feb. 20-21, 2002.
2. Blauch, M., et al. "New Insight into Proppant-Pack Damage Due to Infiltration of Formation Fines," SPE Annual Technical Conference and Exhibition, Houston, Oct. 3-6, 1999.
Test Procedures
Measuring migrating fines
1. Simulate equivalent well flow rate of 100 MMscfd at 4,000 psi and 50 MMscfd at 2,000-psi closure stresses.
2. Dimension each bi-wing fracture at 50 by 100 ft for gas core flow calculations through the simulated formation sand wafer (Brazos River sand) with mesh size less than 200 mesh of 27.3 slm (standard l./min) at 4,000 psi and 13.65 slm at 2,000 psi for 4 hr at each stress.
3. Place a 20/40-mesh ceramic proppant with loading of 5 lb/sq ft between the simulated formation sand wafers. Place Berea sandstone wafers outside of the formation sand wafers (Fig. 5).
4. Test at an initial formation temperature of 250° F.
5. Test at a secondary formation temperature of 325° F.
6. Test at a heat and closure pressure profile to 250° F. and 4,000 psi for 2 hr.
7. Test at a closure stress cycled from 4,000 to 2,000 and back to 4,000 psi (three times).
8. Calculate the width of the formation and proppant pack at each test rate point and stress.
9. Evaluate the conductivity of proppant pack initially with water before core gas flow and at end of test.
10. Evaluate four gas flow rate sweeps through the pack to determine the inertial response from cyclic closure and fines migration from core gas flow.
11. Collect fines at the exit of proppant pack and calculate the fines production.
Measuring conductivity after fines migration
1. Obtain Berea sandstone backer core with a 200-500 md permeability range.
2. Form simulated formation sand wafer using Brazos River sand source with mesh size less than 200 mesh. Place wet sand in core mold and freeze in dry ice (avoid dehydration).
3. Place slurry in core mold and freeze in dry ice (avoid dehydration).
4. Create test cell by making a core proppant sandwich of Berea core, frozen formation sand wafer, 5 lb/sq ft proppant (with or without additive coating), and fill porosity with water. Place formation sand wafer on top, then top with Berea sandstone backer core.
5. Place in press and increase closure to 1,000 psi at a rate of 100 psi/min while opening the fluid proppant entrance and exit lines of the proppant pack. At 1,000 psi, close entrance and exit valves.
6. At exit, collect all fines from the effluent for the test period and record mass.
7. Begin heat ramp and closure stress ramp from room temperature and 1,000 psi. Go to 4,000 psi and 250° F. for a 2-hr incremental ramp of closure and temperature. When the cell temperature reaches 120° F., open the core leakoff lines for excess fluid leakoff while maintaining a backpressure of 100 psi.
8. After obtaining 4,000 psi and 250° F., shut in for 12 hr at temperature and closure stress.
9. Begin flowing through the proppant pack and obtain conductivity with water at rates between 2 and 25 ml/min as required by the proppant pack permeability.
10. Obtain permeability with gas through the proppant pack with selected incremental rates (up ramp and down rate ramp, about 16 total rates).
11. Flow gas through both cores into the proppant pack for 4 hr at an equivalent rate of 100 MMscfd at initial 4,000 psi (normal fracture flow direction from the formation core).
12. Decrease closure stress to 2,000 psi and gas equivalent flow rate to 50 MMscfd; flow gas through core for 4 hr.
13. Increase closure stress to 4,000 psi, and gas equivalent flow rate to 100 MMscfd through core for 4 hr.
14. Obtain second gas sweep (in same manner as above).
15. Repeat the closure stress and rate cycle two additional times, obtaining a gas conductivity analysis sweep at each 4,000-psi stress, for comparison of flow capacity damage due to fines migration.
16. Obtain conductivity with water after the fourth and final gas flow analysis through the proppant pack.
17. Increase temperature to 325° F. and repeat Steps 8-15.
18. Cool, remove cell from press, and freeze before removal of core proppant sandwich from the test cell.
19. Keep frozen until post-test photographic documentation with digital camera and binocular microscope can be analyzed.
The authors
Byron J. Bajoie ([email protected]) is the stimulation technology leader for Halliburton Energy Services in Saudi Arabia, where he is responsible for the development, implementation, and technical execution of stimulation technologies. During his 17-year career, he has held various engineering and technical positions at numerous locations. Bajoie has BS petroleum engineering degrees from Louisiana Tech University, Monroe, and Louisiana State University, Baton Rouge.
Kirk Bartko ([email protected]) is a stimulation specialist with Saudi Aramco, Dhahran, Saudi Arabia, where he is responsible for supporting stimulation and completion applications throughout the company. He previously worked for ARCO. Bartko holds a BS in petroleum engineering from the University of Wyoming.
Philip D. Nguyen ([email protected]) is a technical advisor in production enhancement methods and materials group at the Halliburton Technology Center in Duncan, Okla. His primary areas of interests are well completions and stimulations. Nguyen holds a PhD in chemical engineering from the University of Oklahoma.
