Enhanced geothermal begins in northern Nevada
Fervo Energy drilled and tested an enhanced geothermal system (EGS) in the southern margin of the Blue Mountain geothermal field in Churchill County, northern Nevada. An injector-producer well pair tested at rates up to 30,000 b/d water to produce about 2.5 Mw net power based on an air-cooled organic Rankine cycle (ORC) power conversion calculation. The results showed that horizontal wells could be drilled through hard hot dry rocks (HDR), fractured to connect the well pairs, and economically circulated with water to bring heat to surface.
Blue Mountain EGS
EGS employs an injector-producer well pair to circulate fluid through a fracture network in HDR for heating or electrical generation, depending upon bottom hole and fluid return temperatures. The maximum recorded downhole temperature in Blue Mountain was 376° F. at about 8,000 ft. This temperature is greater than the 250-300° F. minimum bottomhole temperature required for electricity generation (OGJ, Jun. 6, 2022, pp. 40-44).
Vertical- or slanted- well EGS stimulations typically produce single fractures for HDR contact, and these limited pathways restrict heat transfer and production. Multistage fracturing at Blue Mountain addresses this deficiency by creating larger fracture networks along the entire wellbore.
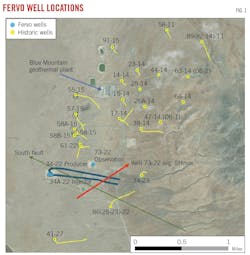
The south side of the field is relatively compartmentalized, containing water within the circulation system. Faulting extends southeast to northwest across the southwest side of Blue Mountain. Image-log data from four existing Blue Mountain wells indicated a 10.3°-99.5° maximum horizontal stress (SHmax) azimuth range, and image logs from monitoring well 73-22 indicate an average 59.5° SHmax orientation with a southwest clockwise rotation trend (Fig. 1). Because Well 73-22 penetrates near the midpoint of the lateral well pair, this data determined lateral well orientation to ensure that propped fractures connect injector to producer.
Drilling
The horizontal wells require a 7-in. production casing string for commercial flow rates and a permanent fiber optic cable cemented behind the production casing for reservoir and wellbore diagnostics. Well trajectory was based on the local stress state and the reservoir’s three-dimensional temperature distribution. A continuous fiber and bottomhole pressure gauge were installed in the monitoring well.
Drilling sequence started with the monitoring well and progressed to injection Well 34A-22. Production Well 34-22 was drilled after the injector was fractured to determine the best path to intersect the injector’s stimulated reservoir volume (SRV). The producer was not stimulated. Injector and producer were spaced an average 365 ft apart, and proppant was detected while drilling the production wellbore, confirming that the well intersected the injection well’s SRV.
Drilling into HDRs is usually slow because most HDRs are solid granite. Deposits at Blue Mountain, how-ever, consist of phyllite and quartzite metasediments and diorite and granodiorite granitic intrusives. The vertical monitoring well was drilled to 8,009-ft MD in 41 days, and the injection well was drilled to 11,220-ft MD in 72 days. Both were drilled to about 7,700-ft TVD. Lessons learned from drilling the injection well resulted in an 18% improvement in drilling time for the production well, with 11,211-ft MD drilled in 59 days.
Downhole discrete temperature gauges and wireline surveys showed a maximum downhole temperature of 376° F. Distributed temperature sensing fiber in the injector was calibrated to these static measurements and showed that the temperature decreased slightly from about 376° F. at the heel to 363° F. at the toe. The wells were drilled relatively level (slightly toe up for the injector and slightly toe down for the producer), and the temperature variation resulted from the regional temperature profile.
Compared with previously drilled wells in the field, the Fervo wells were drilled with a higher maximum dogleg severity (10°/100 ft vs. 3°/100 ft), more casing strings, and larger hole diameters. Regardless, they comprised three out of the five fastest wells drilled in the field. The injector-producer pair were the first horizontal wells and all three were the deepest wells in the field.
Drilling-fluid temperatures were recorded in and out of the mud pits, and downhole temperatures were obtained with a measurement while drilling (MWD) sensor about 92 ft behind the drill bit. The circulating drilling-fluid rate was about 800 gpm, holding bottom hole temperatures to about 225° F. No temperature related failures were recorded for the MWD or directional tools while drilling the injection and production wells.
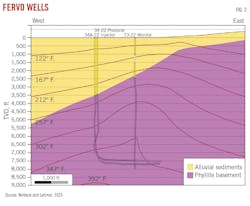
For the injector-producer pair, laterals landed at about 7,700-ft TVD, and productive lateral sections each extended to about 3,250 ft (Fig. 2). Well trajectories avoided zones of potentially high fluid losses. The four primary casing strings for the horizontal wells consisted of:
- Surface casing set at about 800 ft.
- Intermediate casing set in the basement formation at about 3,500 ft.
- Second intermediate casing string set at the end of the curve at about 8,000 ft.
- 7-in., 35-ppf, P-110 production casing from surface to TD.
Permanent fiber optic sensing cables were installed on the production casing in both horizontal wells.
Stimulation
The injection well was stimulated with a 16-stage plug-and-perf hydraulic treatment over a 6-day period from July 21-26, 2022. Standard unconventional horizontal well multistage stimulation techniques per-formed the treatment. Stage length was about 150 ft and each stage contained six clusters with six shots, except for Stages 12 and 13 which had nine clusters each and variable shots within the clusters. A total of 102 perforation clusters were created with 30-ft average spacing. Limited entry perforating encouraged uniform treatment with a designed 1,500-psi pressure drop across the perforations. The pro-duction well was shot with 94 perforation clusters, also at an average spacing of 30 ft, but this well was not stimulated.
Because tools had to be run in the 6.004-in. ID casing and potentially experience full bottom hole static temperature, a modeling study predicted actual working temperatures to determine tool temperature rating requirements. A numerical reservoir simulator modeled dynamic temperatures by including well-bore heat transfer fluid flow-modeling during pump down, fracture propagation, and warm back.
During stimulation at 100 bbl/min (bpm), the model predicted 90° F. wellbore temperature. Following shut-in, the wellbore warmed back rapidly within the first hour and slowly thereafter. At the end of the first shut-in period, the wellbore warmed back to about 265° F. The cycle repeated in subsequent stages. At the end of the 12-hr shut-in period, the wellbore prediction showed warm back to about 300° F.
Based on these estimates, a composite commercial bridge plug and an aluminum commercial bridge plug which have temperature ratings of 300 and 350° F, respectively, were run inside the 7-in. casing. A custom manufactured 450 °F. temperature rating ball-drop flow-through aluminum bridge plug ensured plug success after maximum warm back. The composite plug was run in Stages 1-9, the aluminum plug on Stages 10-15, and the custom plug on Stage 16.
Initial treatment targeted about 17,000 bbl fluid/stage and 540,000 lbs proppant/stage with a 100 bpm injection rate. Proppant was a mixture of 100 mesh and 40/70 mesh silica sand at 0.25-1.50 lb/gal (ppg) concentrations. Fracturing fluid was slickwater with a low-concentration friction reducer additive. Pumping for each stage took about 3 hr. The permanently mounted fiber optic cable monitored distributed temperature (DTS) and acoustics (DAS) for 13 out of the 16 stages.
Fracture breakdown and initiation occurred at all clusters. DAS showed that all six perforation clusters broke down and received flow for the full duration of a stage. Uniformity index—the flowrate distribution to each cluster in a stage—ranged from 56% to 81% across all stages. DAS indicated good stage isolation with little acoustic response downstream of bridge plugs during treatments.
The Stage 1 plug experienced temperatures approaching 300° F. because cool down only came from relatively low-volume and low-rate injection while conveying the wireline assembly via pumpdown operations. By the end of Stage 15, the wellbore had cooled to about 100° F. In between stages, the wellbore warmed back to 200° F. maximum temperature. The observed temperature profiles generally matched the modelling study and were below plug ratings.
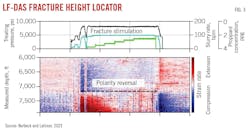
Fracture half-height was determined from the vertical monitoring well’s low-frequency DAS (LF-DAS) response. It measured relative strain changes in the axial dimension of the wellbore above the injection well (the monitoring well did not have fiber below the injection well). Polarity reversal, the change in displacement from compression to extension along the measured depth, identified the location of the vertical fracture tip. Fig. 4 shows polarity flips at about 7,250 ft MD during a single treatment stage. Lateral depth for the injector was about 7,700 ft TVD and fracture height above the wellbore was therefore estimated to be 450 ft for this stage. Not all stages registered the same general height as stress shadowing changed the response during treatment, and the half-height shortened from Stage 1 to Stage 9 and increased afterward. The LF-DAS data were among the first of its type to be recorded in a geothermal well and correlated with other field microseimic measurements.
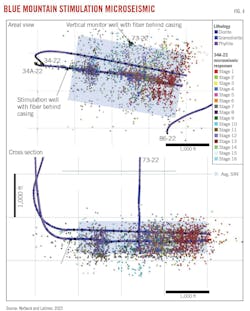
Multiple microseismic sources across Blue Mountain field showed that stimulations followed the NE-SW stress direction in early stages with orientation rotated N-S in later stages near the heel (Fig. 4). Micro-seismic events extended about 1,000 ft in the direction of SHmax, with more extension observed in the northeast direction compared with southwest. The effect may be an artifact of distance from the monitoring well as these sources were obtained from both vertical well and horizontal well fibers.
Vertically, the events are symmetrically distributed and extend about 300 ft above and below the stimulated well on average. The height of microseismic events correlated well with the extension observed in the LF-DAS. Although the monitoring well did not have fiber below the horizontal well, other microseismic data indicate that fractures extended about 300 ft below the well in a symmetric pattern.
In uniform granitic rock, for example at Utah’s FORGE project, there are no layers to constrain vertical height growth, and fractures tend to preferentially grow upward. Blue Mountain’s variations in lithology, however, results in more symmetric growth above and below the wellbore, as was observed in the injector stimulation.
Based on microseismic responses from multiple permanent fiber optic cables, including 5,200 events observed on the vertical monitoring well, the estimated SRV from the injector stimulation extended 1,800 ft in median fracture length and 750 ft in median fracture height along a 3,000-ft well path. The microseismic data confirmed LF-DAS’s effectiveness at monitoring strains in geothermal wells.
Power generation
A production test estimated the power generation potential of the system by circulating a mixture of produced fluid and saline brine into the injection well, through the fractured network, up the production well, and into a series of holding tanks to cool the water for reinjection. Pressure was supplied by pumps on the pad. Instrumentation in both wells measured wellhead pressure, flow rate, and fluid temperature. The test started on Apr. 9, 2023, and lasted 37 days until May 16, 2023.
Tests began with a constant-rate injection period with the production well shut in, followed by a 12-hr pressure falloff period. After that, crossflow was established from injector to producer. Tracers were pumped to determine containment. Subsequently, a steady-state performance test determined flow performance and heat production. The flow profile was logged by wireline before shutting down.
Constant-rate injection began by closing the producer for 42 hr while injecting at about 10 bpm to pressurize the reservoir to nearly 900 psi above initial reservoir pressure. The well was subsequently shut in for pressure fall-off analysis. Pressure transients were observed in all three wells during injection and after shut in. Nearly instantaneous pressure responses occurred at the offset wells, confirming a highly permeable fractured reservoir system.
Crossflow was established by opening the producer, and production at this initial stage came solely from overpressure, confirming that the SRV was relatively confined.
The first steady-state flow test injected fluid at 650-850 gpm, with a maximum 1,003 gpm injection rate (34,388 b/d equivalent). To match expected operating pressures during commercial operations, a gate valve maintained production wellhead pressure at 100-200 psi immediately downstream of the well-head master valve. Injection pressures ranged from 1,000-2,000 psi, with a fracture pressure limit of 2,300 psi. Production rates of 550-750 gpm, with a 970 gpm maximum, resulted in only 10-20% losses in the reservoir. Throughout most of the test, produced fluid in the liquid state eliminated requirements for downhole mass flow rate or produced fluid enthalpy analysis.
Transient pseudo-steady-state pressure occurred after 5-10 hr of constant-rate injection. A consistent 205 psi pressure differential existed between injector and producer. Strong correlation was observed between injector-producer rates and pressures, indicating good hydraulic connection between the well pairs.
Maximum recorded produced fluid temperature was 336° F. The temperature response indicated that no pathways formed to bypass most of the heat reservoir. A spinner log-derived flow profile while injecting at 12.5 bpm showed relatively uniform flow across the injection well’s lateral length (Fig. 5).
Power generation capacity estimates assumed a supercritical ORC operating with 8° C. ambient temperature. Estimated gross power output was 2-3.5 Mw throughout the test, and required pump power was 500-1,000 kw depending on injection rate and pressure.
Induced seismicity
Induced seismicity has cancelled several EGS system installations. To minimize this risk at Blue Mountain, a preliminary screen assessment evaluated risk of induced seismicity at the site following US Department of Energy Protocol for Addressing Induced Seismicity Associated with Enhanced Geothermal Systems guidelines. The Blue Mountain field has minimal natural seismicity based on a review of the US Geological Survey ComCat earthquake catalog since the power plant started operations in 2009.
A green, yellow, and red traffic light protocol dictates operating conditions based on measurement from a local seismic monitoring network. Normal operations continue under green (event magnitudes M < 2.0). Operations are modified under yellow (2.0 ≤ M < 3.0) to reduce the risk of triggering larger events. Modifications include reducing pumping volumes, reducing injection rates, and suspending operations. Under red (M ≥ 3.0), injection is shut down, fluid is flowed back to reduced reservoir pressures, and operations are suspended for further review.
During periods without active operations, background seismicity was about 3-5 events per week. Seismicity increased during periods of stimulation or well testing with highest seismicity rates during the stimulation treatment. The largest magnitude recorded was an M = 1.8 event, which occurred during the 37-day crossflow test. All observed seismicity remained within the green level throughout all phases of the project.
Bibliography
Norbeck, J., Latimer, T., Gradl, C., Agarwal, S., Dadi, S., Eddy, E., Fercho, S., Lang, C., McConville, E., Titov, A., Voller, K., and Woitt, M., “A Review of Drilling, Completion, and Stimulation of a Horizontal Geothermal Well System in Noth-Central Nevada,” 48th Workshop on Geothermal Reservoir Engineering, Stan-ford University, Stanford, Calif., Feb. 6-8, 2023.
Norbeck, J. and Latimer, T., “Commercial-Scale Demonstration of a First-of-a-kind Enhanced Geothermal System,” EarthArXiv, July 18, 2023.
McClure, M., “Calibration Parameters Required to Match the Utah Forge 16A(78)-32 Stage 3 Stimulation with a Planar Fracturing Model,” 48th Workshop on Geothermal Reservoir Engineering, Stanford University, Stanford, Calif., Feb. 6-8, 2023.
About the Author
Alex Procyk
Upstream Editor
Alex Procyk is Upstream Editor at Oil & Gas Journal. He has also served as a principal technical professional at Halliburton and as a completion engineer at ConocoPhillips. He holds a BS in chemistry (1987) from Kent State University and a PhD in chemistry (1992) from Carnegie Mellon University. He is a member of the Society of Petroleum Engineers (SPE).


