Finding, mapping temperature anomalies can aid oil, gas exploration
New Views of the Subsurface
This article augments OGJ's exploration special report, New Views of the Subsurface, which starts on p. 68.
Negative temperature anomalies exist above and positive temperature anomalies below hydrocarbon deposits. The greater the hydrocarbon thickness of the deposit, the greater the anomaly above it.
Anomaly magnitude decreases with vertical distance from the deposit. Negative anomalies over hydrocarbon deposits extend beyond the earth's surface and into the near-surface atmosphere.
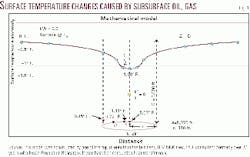
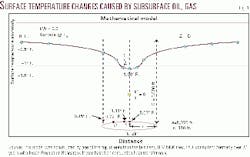
In single pay zone situations, subsurface negative anomalies intensify approaching an underlying hydrocarbon deposit, attain a value of zero anomaly at mid-pay, and become progressively more positive until the bottom of the pay is reached (Fig. 1).
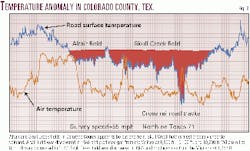
The method is based on the collecting of temperature data with construction and interpretation of temperature anomaly maps. Many years of work and massive data have demonstrated system accuracy, capability, and extraordinary value. Although not perfect, Temperature Anomaly Mapping may be our industry's best hydrocarbon exploration method (Fig. 2).
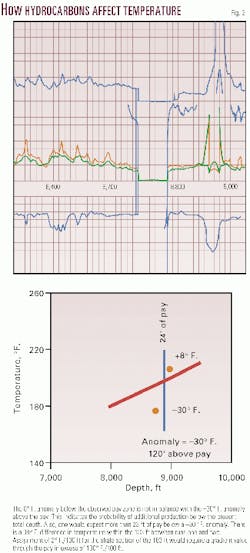
Where a number of pay zones exist at a single location one would, in most instances, observe a negative anomaly below the shallowest pay because of the remaining underlying hydrocarbon deposits (Fig. 3). Because of the quantitative relationship between anomalies and hydrocarbons, one can often pick and evaluate productive intervals from multiple-run log headings alone. This can be done without opening the log, using maps or geology, or knowing production history for the area.
Temperature gradients and heat flow can be equated to electrical voltage and electric current. Electric current requires a voltage gradient. Heat transfer requires a temperature gradient. Below about 20 m depth at any one location, the amount of heat traveling toward the surface is identical at all depths. Proponents of linear gradients would have to concede that all subsurface sedimentary materials at any depth have identical heat transfer ability.
In most instances, no supplementary technology (previously drilled holes or even previous exploration data) is required to find and evaluate prospective hydrocarbon deposits. The method can lower costs by reducing or eliminating the need for seismic surveys and minimizing the risk of leasing unnecessary land and drilling dry holes. Commonly, the cost of employing this new system is less than 1% that of seismic surveys. Prospect development by temperature analysis may be accomplished from either archival information or current surveying (Fig. 4).
Determining temperatures
Most logging companies have been less than professional in collecting and documenting bottomhole temperature data to the point where extreme caution must be taken when obtaining and processing existing BHT data.
Interviews with more than a score of North American logging engineers indicate the probability that more than 25% (80% in some areas) of all bottomhole temperature values appearing on log headings have been estimated (fudged) rather than measured with a thermometer and recorded, with no record of simple estimation on the log heading.
Subsurface materials with the highest "thermal conductivity" are not necessarily the best transmitters of heat. There is a universal relationship between subsurface temperature gradient versus heat transmission ability, but not versus "thermal conductivity." Thermal conductivity as defined by the CRC Handbook of Chemistry and Physics, CRC Press, apparently changed in 1992:
- 60th Edition, 1979-80: "The rate of transfer of heat by conduction through unit thickness across unit area for unit difference in temperature ellipse is measured as calories per second per square centimeter for a thickness of one centimeter and a difference of temperature of 1° C."
- 81st Edition, 2000-01: "Rate of heat flow divided by area and by temperature gradient." (Here, CRC Press acknowledges IOS Standards Handbook, Units of Measurement, Inter- national Organization for Stan- dardization, Geneva, Switzer- land, 1992).
Experiments demonstrate significant convection heat flow in all porous sediments. A controlled temperature heater coil centered in a sizable (370 lb) sand pack with thermocouples placed at equal distances above and below the regulated heat source were used. The sand-air model under standard temperature and pressure conditions showed upward temperature change (effects of convection plus conduction) 2.25 times that of the downward temperature change (conduction flow).
A sand-water model study showed upward temperature change (effects of convection plus conduction) nine times that of the downward temperature change (conduction transfer). Both sand packs had a porosity of about 331/3%. By arithmetic averaging of published values of thermal conductivity and assuming 331/3% porosity:
Quartz=16.96 x 0.6667 = 11.307
Water = 1.39
Air = 0.061
Then, by arithmetic averaging, quartz-water is 11.770 and quartz-air is 11.327 for a ratio between the two of 1.039; In actuality, upward heat transfer for:
Sand-water = 11.770 x 9.00 = 105.930
Sand-air = 11.327 x 2.25 = 25.486
Considering convective flow, the ratio becomes 4.156. Adding the effects of immiscible hydrocarbon-water barriers found in all pay zones, the ratio becomes very much greater and about nine.
The two most efficient nonmetallic upward heat transfer agents in porous subsurface sediments are water and oil and not halite, quartz, or dolomite. In the subsurface, convective heat flow is commonly the dominant heat flow mechanism.
Experiments show that upward heat transfer in/of water under STP conditions is more than 18 times downward heat transfer. Multiplying the thermal conductivity of water by 18, the result is 25.02, whereas the reported value for halite varies from 3.11 to 17.21 with an average of 9.56. After consideration of formation water salinity, the fraction of sediments occupied by both water and oil can be estimated by simple interpretation of well log resistivity and porosity data.
Water within most porous sediments including clay and shale is continuous and interconnected. For the many who claim there is no convective flow in the subsurface, let them explain how oil and gas accumulate in structurally high traps within the subsurface. Within the earth a temperature gradient will always be encountered. Temperaturewise, there is no such thing as static equilibrium. As long as a gradient exists, continuous heat transfer will occur.
The most important factors causing negative temperature anomalies are the thickness of the hydrocarbon reservoir and the number of immiscible boundaries per unit volume of material under investigation. Moderate thickness, very high permeability vugular pay zones are the most difficult to identify using temperature methods alone because they contain a minimal number of immiscible boundaries.
In water zones, thermal transfer generally increases with permeability because of relatively greater convective heat transfer within the larger, more directly connected pores associated with higher permeability. This is only partly offset by fewer grain contacts (less rock frame coupling) within such formations. Oil in hydrocarbon reservoirs is always in contact with connate water.
Oil and water are immiscible. Their molecules repel each other. Oil molecules attract other oil molecules. Water molecules attract other water molecules.
At every oil-water interface, dissimilar molecules with similar surface charges are repulsed by opposite force fields, preventing cross-gender diffusion and mixing. At each of the untold billions of immiscible boundaries within commercial hydrocarbon reservoirs, heat transfer by natural convection and/or diffusion is prevented.
As Summerton et al. wrote, "Sand plus water thermal conductivity is 11 times that of sand plus air."1 This is interesting considering commonly published values for thermal conductivity of quartz to be 14.0, water 1.39, and air 0.061.
Arithmetic averaging of components in 35% porosity sand yields 9.52 versus 9.12 for a "theoretical" ratio of 1.04-to-1 rather than the "actual" ratio of 11-to-1. Did the authors use the term "thermal conductivity" when they actually meant "heat transfer ability?"
Results of surveys
To date more than 100,000 miles of surveys have been performed by use of one or more of the following methods:
- Infrared derived surface temperature surveys.
- Processing BHT data.
- Subsurface, fixed depth, water temperature (below any thermocline) profiles.
- Subsurface temperatures obtained from the bottom of shallow (generally 5 ft) depth drillholes.
- Measurement of air temperature a short, fixed distance above ground surface.
Consider 100 miles of seismic survey at $12,000/mile ($1.2 million) versus 75¢/mile by surface vehicle ($75), requiring but 100 min of one man's time at a survey speed of 60 mph. The cost ratio is more than 500-to-1 in favor of temperature mapping, without considerations of environmental impact, processing, permitting, damage fees, and effectiveness, all of which highly favor the temperature method.
Thirteen randomly selected road surveys of ambient air temperature taken 28 in. above ground surface were performed by automobile resulting in observed 2° F.-to-4° F. negative anomalies over most commercial hydrocarbon deposits. In every case, the selection of the most negative anomalies would have resulted in a commercial discovery had the surveys been performed before initial drilling.
Atmospheric conditions during the surveys were clear, with no observed strong wind gusts. Changes in surface elevation were gradual and less than 200 ft.
Variations in surface elevation require some consideration. As one gets farther from the center of the earth it gets cooler. As a result, a 3,000-ft well BHT obtained near the top of a 3,000-ft rise above a valley floor cannot be directly compared to a nearby 3,000-ft well BHT obtained from a well drilled from the valley floor.
This points to the probability that under the right conditions, the use of outside temperature observation as read from an automobile (standard equipment on most of today's luxury cars), conducted by any one of our readers, may well be a more reasonable first pass exploration tool than the costly, currently used methods.
Claims and convention
Industry marketing of various exploration and production techniques and services is, in many instances, far from forthright.
If one were to drill his first wildcat hole in the middle of a huge field (Hugoton, San Juan, Elmworth, East Texas, etc.) and then step-out to drill ten "wildcats," each 4 miles apart, no matter what exploration method were used, he could claim that his search technology was perfect because of his drilling of 10 successive discoveries without a dry hole.
One Canadian company drilled 20 successful wildcats in a row. They were brilliant in identifying the middle of a super-huge field, but after that they could have drilled in the direction the wind blew and would have still batted 20 for 20.
Huge amounts of exploration money are being wasted. Many of today's managers consider any new procedure to be a threat to their present work routine and that "nothing should be done for the first time." Some even live with, "It isn't that it makes sense, its just that it's been company policy for the past 40 years."
In Michigan in the 1940s one major oil company did not believe in running electric logs. In the early 1930s, Schlumberger left the US because not enough people believed in the worth of its services. The USGS at one time stated: "There is little or no chance for oil in California," and, "There is little or no chance for oil in Kansas or Texas." The US Department of the Interior in 1939 stated: "Our Nation has only a 13-year supply of oil left."
One should periodically re-examine our exploration methods in an attempt to improve them. Working harder with present exploration tools and methods is not necessarily the best solution to guarantee a higher success rate in the future.
What would have happened if Thomas Edison had directed all his efforts toward improving the kerosene lamp? Too often, the only thing harder than getting a new idea into a major oil company exploration department is getting an old idea out.
Convection heat flow plays a more important role than conduction heat transfer for finding hydrocarbons in sedimentary basins. This is supported by industry observation that heat flow is greatest in the ocean basins, lesser on the continents, and least on the Precambrian shields. If one uses only the published values for thermal conductivity of the sediment components and their contained fluids and multiplies each value by its fractional volume, the predicted relationship for heat flow comes out exactly opposite from what is observed.
Density increases with depth and pressure and controls buoyancy flow. Fluid density generally decreases upward. Molecules travel farther in the upward direction before they interact ("collide") with other molecules or their force fields.
Increased density of fluids leads to increased backscattering, decreased diffusion, and reversal of the direction of molecular velocity forces. Heat transport properties of gases increase with density. Oil and gas are less dense than connate water. As density increases, mean free path between molecules decreases and interactions between molecules increase. In general, the magnitude of thermal conductivity values decreases markedly as we consider them in the order of decreasing density.
For a given pore space and fluid, molecules at greater depth are more closely packed and reflect diffusion-type molecular "projectiles" upward to a greater degree than the downward reflection or rebound from the more widely scattered shallower molecules of the adjoining strata. The mean free path for molecules traveling in the upward direction is greater than that of the downward direction.
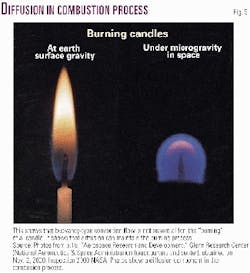
Diffusion is a natural phenomenon caused by constant motion and collision of molecules. It is the gradual mixing of molecules without the application of external forces which in the subsurface results in a net movement of molecules from an area of high concentration to one of lower concentration under conditions of dynamic equilibrium.
The farther apart the molecules are from each other the fewer interactions ("collisions") and the more rapid the diffusion. Molecules in gases are farther apart than in liquids, hence, diffusion is more rapid in gases than in liquids. Rates of diffusion of different gasses at a given temperature are inversely proportional to the square root of their molecular weights. As an example, hydrogen diffuses four times as fast as oxygen. Diffusion creates the exchange of kinetic energy (Fig. 5).
An Illinois State Geological Survey ultracentrifuge study of crude oil samples resulted in separation into five unique density and color segments that were undifferentiated in situ. This would indicate that diffusion is alive and well at all times under existing subsurface sedimentary circumstances and that true density equilibrium is never fully accomplished in fluids.
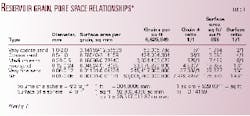
The number of immiscible interfaces per unit volume of sediment is crucial in determining the magnitude of insulation. Pore geometry is also a factor. In unconsolidated sands of a given porosity, the finer the sand the greater the number of pore spaces and grain surface area per unit volume (Fig. 6). One or more pores can be expected for every sand grain within any unit volume.
In productive intervals there will always be two immiscible (oil-water or gas-water) barriers within each pore. However, no sands have completely uniform size grains and the grains are never perfect spheres.
Fine-grained oil reservoirs are better insulators than coarse-grained oil reservoirs because even though they contain more water, they contain a much larger number of immiscible oil-water interfaces that impede convection heat transfer.
Twenty percent porosity oil sands with 30% water saturation have been found that produce mostly water, while other 20% porosity sands with 60% water saturation produce only clean oil. These relationships are related to pore size, internal pore surface area, and the forces of adhesion and cohesion of their contained fluids (Table 1).
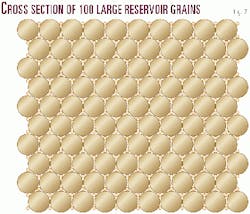
Rhombohedral packing, the most compact arrangement of uniform spheres, yields 25.45% porosity. Cubic packing, which is far from possible in nature, would yield 47.64% porosity. Nonuniformity of grain size makes for lower porosities in that many of the smaller grains fit within what would have been pores formed by larger grains had the smaller grains not been present.
Note the cross-section of 100 large grains without the small grains shown in each pore space (Fig. 7). Within the 100 large grains area one can count 159 pore spaces. This would suggest 1.59 pores per grain. By placing a small grain within each of the 159 pores, one adds 318 pores to the system. This yields 100 + 159 = 259 total grains and 159 + 318 = 477 pores for 1.842 pores per grain in the two dimensional area.
In pay zones there are two immiscible hydrocarbon-water contacts and two immiscible water-grain surface contacts in each pore space. One must remember that essentially all the pores are interconnected and that the hydrocarbon geometry is quite complex.
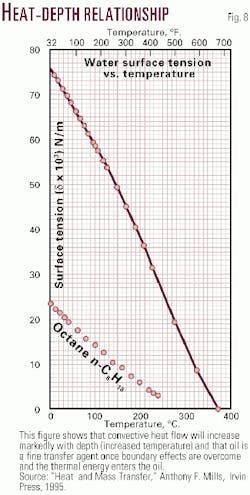
Surface tension of liquids increases with increasing cohesive power. Surface molecules are pulled toward subsurface molecules which results in a contraction of the liquid surface and a closer concentration of molecules with increased density of the very near surface. Surface tension decreases with temperature and depth (Fig. 8).
Thermal conductivity generally increases in nonmetallic solids with increasing temperature and density. Thermal conductivities of liquids decrease with increasing temperatures. Thermal conductivities of gases and vapors vary widely with temperature and pressure but generally increase with increasing temperature and decrease with increasing weight.
The "thermal conductivity" of sandstone is stated as 2.15-to-15.77.2 Since "sandstone" porosity, pore fluid type, and geometry are not mentioned, these values are not much help in predicting heat transfer.
Comparisons between different borehole fluids (glycerol versus water)3 indicate a steeper gradient in a glycerol-filled borehole than in the same hole when stabilized after filling with water. In a test well the glycerol-filled borehole gradient, even after a one-week stabilization period, was 3.27 times that observed when the same borehole was filled with water.
Tests by Sammel showed a lack of convection cells (resulting in stable measurements) within shallow boreholes filled with glycerol. In opposition, those filled with water, where the temperatures varied cyclically with time, were considered unstable.
Glycerol (CH2OHCHOHC2) (CH3H8O3) has a melting point 68° F., boiling point 359° F., and molecular weight of 92.09. Glycerol at 68° F. has a CGS (metric) thermal conductivity of 0.000703, as compared with 0.00139 for water. The specific gravity of glycerol is 1.2633 g/cc, whereas that of water is 1.000 g/cc. The viscosity of glycerol at 68° F. relative to that of water is 1,759.6. The "fluidity" of glycerol, considering water to be 100 at 68° F., is 0.06.
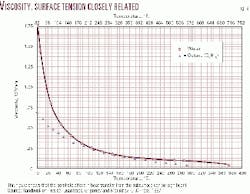
This indicates that for temperatures measured within the borehole under certain conditions, the heat transfer effect of borehole fluids is equal to or greater than the effect of the formations immediately surrounding the borehole in determining the "temperature at a given depth." The viscosity of drilling mud decreases rapidly with depth and increasing temperature (Fig. 9).
Water-filled porous sedimentary units that are highly tilted from the horizontal are better transmitters of vertical heat flow than are those in the horizontal position. This could cause positive temperature anomalies over nonproductive, steeply dipping structures. It could also, under certain circumstances, mask the insulative effects of minor hydrocarbon accumulations within the structure.
Challenges
Here are 10 commandments for finding hydrocarbons using temperature data.
- If you find this article reasonable, evaluate the method using both logic and statistics. Compare its efficiency with other methods and select the best course of action after evaluation of accuracy, speed, cost, and environmental impact.
- Save money, improve efficiency, and maximize profits.
- Find and evaluate hydrocarbon deposits and do not drill a dry hole.
- Do not buy, sell, or abandon a property without first reviewing temperature data.
- Do not offset a producing well before reviewing temperature data.
- Select and prioritize the best areas for leasing and drilling.
- Correctly evaluate the deeper drilling potential and value of present properties.
- Compare the bottomhole temperature from shallower logging runs to the average regional temperature at the same depth to determine if drilling should continue or be terminated.
- Consider setting up a study group section, using the new method to review and possibly purchase all attractively priced industry wells and fields as they are put up for sale.
- Do not believe most textbook definitions of "thermal conductivity" or use published values of "thermal conductivity" to determine earth heat transmission to the surface in sedimentary basins.
References
- Summerton, Keese, and Chu, "Thermal Behavior of Unconsolidated Oil Sands," SPE Meeting, October, 1974.
- Grigoriev & Meilikov, "Handbook of Physical Quantities," CRC Press, 1997.
- Sammel, Edward A., US Geological Survey, SEG Paper #647, 1968.
Bibliography
Fons, Lloyd, "Temperature methods can help locate oil, gas deposits," OGJ, Apr. 12, 1999, p. 58.
Fons, Lloyd, "Use of temperature anomaly mapping to quantitatively identify subsurface hydrocarbons," World Oil, September 2000.
Fons, Lloyd, "Temperature anomaly mapping: A risk-reducing technology," GCAGS Transactions, Vol. L, 2000.
The author
Lloyd Fons has been president of his own exploration company in Houston since 1980. While consulting to Canadian Hunter Exploration Ltd. in the 1970s, he was instrumental in discovery of giant Elmworth gas field in Alberta, which more than doubled Canada's gas reserves within 5 years. He worked since the 1940s with Schlumberger Well Services, Seismograph Service Corp. Birdwell Division, Pan Geo Atlas Corp., Natural Gas Pipeline Co. of America, Sneider and Meckel Associates, and others. He studied at Dartmouth College and holds a BS degree in geology with graduate work from the University of Chicago.
