Capital Spending Outlook: Strong oil, gas prices continue to fuel capital spending
The copious pool of funds derived from the past year and a half's strong crude oil and natural gas prices allows for the healthy capital investment of 2000 to continue in 2001.
Oil & Gas Journal's annual capital spending survey reveals that expenditures in the US, Canada, and elsewhere will top 2000 levels. Spending in the US and Canada will continue to rise, though by much smaller margins than last year. Outside the US and Canada, investments made by the companies surveyed will also increase, reversing last year's declines.
A year ago, the survey indicated that US exploration and production spending would rise by about 29%. This proved conservative, as the new survey shows that the actual increase was 50%.
Companies are remaining cautious with spending plans. Recent price volatility in the market remains on the minds of project planners and lends uncertainty as to how much money will be available for investment should prices fall again.
Supply, demand, prices
International Energy Agency figures show worldwide demand for oil rising to 75.5 million b/d last year and to 77 million b/d this year from 74.8 million b/d in 1999. During this period, production has greatly fluctuated, as have prices.
Total supply in 1999, according to IEA, averaged just 74.1 million b/d as the Organization of Petroleum Exporting Countries held production down. This, coupled with low stocks, started to drive oil prices toward their recent highs. In 2000, when total world oil supply averaged 76.7 million b/d, the world export price of oil averaged $27.51/bbl, up from 1999's average of $17.37/bbl. The monthly average world export price peaked last year in September at $31.15/bbl.
Since then, the price has moderated, and the average world export price of oil this past February was $25.81/bbl. OGJ estimates that total worldwide supply this year will be 78.4 million b/d (OGJ, Jan. 29, 2001, p. 83), which should help stabilize prices in the mid-$20s/bbl.
The average price for the US benchmark crude, West Texas Intermediate, moved up to $30.19/bbl last year from a 1999 average of $19.16/bbl. The average price for WTI this past February was $29.74/bbl.
Demand for gas in the US has been strong during the past year, with total consumption up to 22.688 tcf in 2000 vs. 21.703 tcf a year earlier, according to the US Energy Information Administration (EIA). Total US consumption of gas in 1998, at 21.262 tcf, was the lowest since 1994.
Heavier use of gas for power generation has created dual peaks in demand such that consumption not only peaks during the winter heating season but also spikes a bit during the summer cooling season.
This trend of increased gas consumption has pushed prices up to unprecedented levels. The US wellhead price for gas was an average $6.35/MMbtu last December and for 2000, the price averaged $3.60/MMbtu. The average US wellhead price in 1999 was $2.17/MMbtu.
The New York Mercantile Exchange futures price for gas averaged $4.26/MMbtu last year compared with $2.31/MMbtu a year earlier. The all-time highest monthly average price for NYMEX gas was recorded last December at $8.32/MMbtu. By this past February, lower demand helped the price dip to an average $5.78/MMbtu.
Production of gas in the US has gotten a boost from the higher prices. EIA estimates that December 2000 marketed production was 1.79 tcf, compared with December 1999 production of 1.62 tcf.
US upstream spending
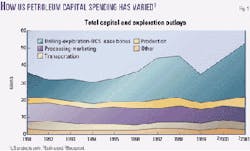
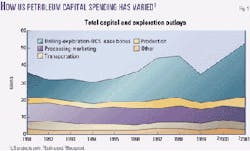
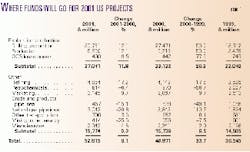
Companies plan to increase their US upstream spending again for 2001, but the change will be much smaller than last year's. Higher prices in 2000 generated greater cash flows, thereby allowing more money to be spent for upstream projects as well as encouraging investment in order to capture a strong return. US upstream expenditures last year totaled $33.1 billion, exceeding those in 1999 by 50.3%. This year, companies will spend $37 billion on upstream projects in the US, for an increase of 11.8%.
Capital expenditures for exploration and drilling, totaling $30.8 billion, will be 12.1% higher than last year's level. E&D spending in 1999, when low oil prices provided little incentive for investment, was a relatively abysmal $21.8 billion compared with 1998 E&D spending of $27.2 billion.
Outlays for US production and enhanced recovery projects are expected to increase in 2001 to $5.85 billion, up from $5.22 billion last year and $3.48 billion in 1999. Wellhead revenues, which vary along with production and price, are estimated to fall 9.7% this year to $116.9 billion, down from $129.4 billion last year but still substantially higher than 1999 wellhead revenues of $74.2 billion.
OGJ forecasts that the number of US well completions will escalate this year to 27,550. This indicator of upstream spending reached a modern low in 1999 at 18,180 total wells, then rebounded last year to 25,945 (OGJ, Jan. 29, 2001, p. 85).
Another indicator of upstream activity, the Baker Hughes Inc. count of active rotary rigs in the US for the week ending Mar. 9, 2001, averaged 1,158, of which 903 were rigs drilling for natural gas. For the same week in 2000, the Baker Hughes count totaled 768.
In still another upstream indicator, OGJ estimates that Outer Continental Shelf (OCS) bonus payments will fall this year to $400 million, following a surge last year to $442 million from two strong Minerals Management Service (MMS) lease sales. In 1999, OCS payments amounted to $249 million, also the result of two sales. MMS scheduled three lease sales for this year but is reluctant to count on the third-a sale scheduled in the eastern Gulf of Mexico off Florida-coming to fruition. This sale, scheduled for December, is in question as the state, citing environmental and tourism concerns, opposes such leasing off its shores.
Non-E&P spending
US non-E&P spending is expected to move up to $15.8 billion this year, an increase of only 0.2% over last year's non-E&P spending. This slight change follows an 8.5% jump last year from 1999's non-E&P outlays of $14.5 billion.
The small overall change this year conceals the swings taking place in the individual sectors of the industry. For example, US spending for pipelines will fall 20.1%, while refining investments will be up by nearly the same percentage.
US investments for refining in 2001 will total $4.9 billion, up 17.2% from last year. Increased spending at refineries often signals a boost in demand for products. Refiners have been adding capacity to meet demand growth during the past decade. In addition, tougher environmental restrictions-especially new federal limits looming for sulfur levels in gasoline and diesel-require upgrades and revamps to existing units. Capital expenditures for US refineries have moved up every year since 1997.
Spending at petrochemical plants in the US has diminished every year since 1998 and will drop this year by 6.4%. Petrochemical outlays, as high as $2 billion in 1999, will total $814 million this year. Marketing budgets are continuing to expand, however. Following a 9.7% gain from 1999 to 2000, such spending will grow by that rate again this year to $3.1 billion as a result of improved cash flows.
Spending on gas pipelines is expected to decline this year by 20.8%, after more than doubling from 1999 to 2000. US construction of new gas pipelines in 2001 is projected to total 2,445 miles, down from 3,222 miles last year, while 578 miles of crude and products lines are planned this year vs. 660 miles in 2000 (OGJ, Feb. 5, 2001, p. 61). In 1999, plans called for only 1,734 miles of gas lines and 1,540 miles of crude and products lines to be laid in the US (OGJ, Feb. 8, 1999, p. 36). Expenditures for crude and products pipelines are pegged at $457 million this year, a decline of 15.1%. Spending for these lines also dropped last year, by 49.1%. Investments in transportation equipment other than pipelines are expected to grow 3.5% to $706 million, after eking out a mere 0.1% gain last year.
Petroleum companies will spend $414 million for mining and other nonpetroleum energy projects in the US this year, down from last year's $556 million investment and 1999's $601 expenditures for these projects.
Capital spending in Canada
An increase in total outlays in Canada is expected this year. While E&P spending in Canada will get a boost, non-E&P expenditures will decrease slightly.
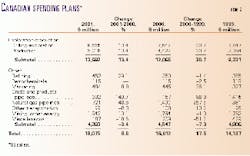
Total spending in Canada will move up 8.8% this year to $18.1 billion. Last year, total spending in Canada increased 17.5% to $16.6 billion from 1999 spending of $14.1 billion.
Again this year, expenditures in Canada are heavily weighted on the E&P side of the industry. As US demand for Canadian gas has grown over the past decade, production and therefore capital outlays for gas projects have risen substantially. In the early 1990s, Canadian E&P spending averaged only $5.5 billion/year.
Last year, Canadian upstream spending jumped 30.7% to $12.1 billion. This year, spending for drilling, exploration, and production is expected to move up 13.4% to $13.7 billion. Drilling and exploration expenditures will be $8.7 billion compared with $7.6 billion last year. Spending for production in Canada will total $5.0 billion vs. $4.4 billion a year ago.
The 2000 Canadian weekly rig count gained some of the ground it lost in 1998 and 1999. In 1997, the average count was 375, then in 1998, it dropped to 261. In 1999, the count dipped further to 246. Last year, the count rebounded to 345. For February 2001, the average weekly tally of active rigs in Canada stood at 562.
Well completions in Canada will continue to climb this year. OGJ estimates that well completions will total 18,972, an increase of 13.4% following a 30.7% jump last year.
Non-E&P spending in Canada is expected to fall, though by less than it did last year. In 1998 and 1999, non-E&P outlays were buoyed by strong spending for the construction of crude and products pipelines. Last year, though, spending for these pipelines declined nearly 90% to $157 million. Expenditures for crude and products pipelines in Canada are expected to bounce back 150% this year to $392 million.
Outlays for gas pipelines in 1999 totaled $381 million, then moved up to $1.4 billion last year. This year, spending in this area will be a more-modest $721 million.
A total of 1,312 miles of new pipeline is planned for construction this year in Canada. Of this total, 967 miles will be gas pipelines (OGJ, Feb.5, 2001, p.61). In 2000, a total of 1,420 miles of new pipeline construction was planned, including 1,047 miles for gas lines (OGJ, Feb. 7, 2000, p. 36).
Expenditures in Canada for other modes of transportation will drop 8.3% following a 10.2% increase last year.
Spending in the refining sector will be up more than 29% to $452 million, after dropping slightly last year to $350 million. Petrochemical expenditures will be $115 million, unchanged from last year.
Marketing outlays in Canada are projected to increase 8.8% this year to $484 million. Spending will also increase for mining and other energy projects, including oil sands development. Such expenditures will total $1.9 billion, a 10.1% increase from last year.
Spending outside US and Canada
Capital expenditures outside the US and Canada will also move up this year, reversing course from 2000. The survey that OGJ conducted last year revealed that although 2000 capital spending was on the rise in the US and Canada, outlays for the year in other geographical areas would be less than it was in 1999.
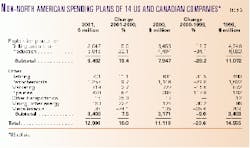
This year's survey collected data from 14 companies based in the US and Canada that are planning projects that involve capital and exploration expenditures outside the US and Canada in 2001. These companies plan to increase spending on such projects by 16%. This will bring spending outside the US and Canada by these companies up to $12.9 billion from $11.1 billion last year, but still less than the $14.6 billion they spent in 1999.
More of a spending increase will occur in the E&P sector than in other categories. Production expenditures are expected to surge by a little more than 30%. These outlays dropped by 34.1% from 1999 to 2000 for this group of companies.
Drilling and exploration spending by these companies in areas outside the US and Canada will show modest gains, moving up 5.6% after dropping 18.7% from 1999 to 2000. In total, upstream spending by the 14 companies that OGJ surveyed will increase 19.4%.
Downstream capital expenditures outside the US and Canada by these companies also will recover from the cuts made in 2000, posting a 7.5% gain compared with a 9% drop the previous year.
Taking a closer look at each category of spending shows that there is no single trend, however. For example, refining spending will move up 11.1% this year following a 31.5% gain last year, while expenditures in the petrochemical arena will increase this year 9.7%. This follows a decline in petrochemical spending outside the US and Canada of nearly 30% last year. Marketing expenditures by these companies are expected to grow 12.7%, whereas they fell 16.6% last year.
The companies in the survey will continue to increase spending for pipelines this year, though by a much smaller margin than in 2000. These companies in 1999 spent $182 million for pipelines, then more than doubled such expenditures last year to $395 million; this year, they are expected to increase spending for pipelines by 8.4% to $428 million.
All other non-E&P spending by these 14 companies will total $203 million, a 25.4% drop from 2000.
