Kinetic EIT is best method for determining catalyst bed temperatures
Determining the average catalyst-bed temperature by applying an Arrhenius-type rate equation gives a closer to isothermal temperature than other methods.
The engineer must apply an appropriate activation energy for each reactor-thermocouple readout.
After reviewing various methods of representing the average reactor temperatures of hydrotreating units, Syncrude Canada Ltd.'s Edmonton Research Centre and Fort McMurray Operations found that this kinetically determined EIT (equivalent isothermal temperature) is the best method for expressing commercial reactor temperatures.
Syncrude applied the newly developed kinetic EIT approach to commercial plant data and compared the results with those based on conventionally determined average reactor-bed temperatures. Initial catalyst activity and catalyst deactivation rate determined using the kinetic EIT were different from those determined using conventional methods.
Syncrude currently applies the kinetic EIT approach in its commercial hydrotreating units to monitor catalyst performance.
Background
Syncrude operates a surface-mining oilsands plant in northern Alberta and produces Syncrude Sweet Blend (SSB) crude oil. Articles on Canada's oilsands industry and Syncrude operations, the quality of FCC feeds from SSB, and coker naphtha hydrotreating have appeared recently (OGJ, Jan. 19, 1998, p. 43; June 28, 1999, p. 44; and Sept. 6, 1999, p. 64).
Syncrude has five fixed-bed hydrotreating units: two naphtha hydrotreaters, one light gas oil (LGO) hydrotreater, and two heavy gas oil (HGO) hydrotreaters. The total catalyst loaded is about 1.5 million lb (680 tonnes).
This volume is huge and directly affects operating costs. Catalyst management is therefore essential for optimum unit operation. Routine monitoring of catalyst activity is one way to achieve this. Monitoring is normally done by noting the trend of the average reactor temperatures.
In a pilot-scale hydrotreating unit, reactors are generally small and experiments are performed at isothermal conditions. That is, the radial and axial temperature gradients are negligible, although the hydrotreating reaction is exothermic. Calculating the average reactor temperature of pilot-scale reactors is, therefore, straightforward.
However, in large-scale commercial reactors, the bed is not isothermal but adiabatic. Consequently, the temperature varies throughout the bed. The average reactor temperature should, therefore, be expressed by an EIT.
Refiners, catalyst vendors, and engineering consultants use various simplified methods to approximate the average temperature of the adiabatic reactors. The most accurate estimation of the reactor EIT is determined by using all thermocouple readouts in the catalyst bed and an Arrhenius-type rate equation with appropriate activation energy. This is referred to as the kinetic EIT.
Reactor temperature profile
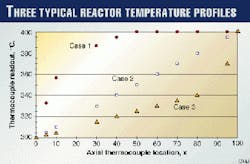
Fig. 1 illustrates three typical temperature profiles that are normally observed in commercial hydrotreating reactors.
In this figure, Case 1 shows a situation in which the reactor temperature increases rapidly, reaches the maximum at about halfway through the reactor, and maintains the same temperature all the way to the reactor outlet.
Case 2 shows a situation in which the reactor temperature increases linearly throughout the reactor.
Case 3 shows a situation in which the reactor temperature increases slowly and linearly up to a point in the bed. About 80% through the reactor, the temperature increases significantly in the remaining part of the reactor.
In preparing Fig. 1, the following assumptions were made:
- The temperatures at the reactor inlet (300° C. at x = 0) and outlet (400° C. at x = 100) are the same for all cases.
- The axial locations of the thermocouples are at the same intervals (Dx = 10), except in the region of inlet and outlet. There are two more thermocouples at x = 5 and 95.
- The thermocouples at x = 20 and 90 were broken and out of service.
There are many ways of expressing the average reactor bed temperature: for examples, WABT (weighted average bed temperature), ABT, 2/3 EIT, and 3-point EIT. They are summarized in the definition box.
The WABT and ABT are the same when the thermocouples are evenly located throughout the reactor bed. The 2/3 EIT is well known and widely used in refineries for catalyst monitoring and for reactor design. The 2/3 EIT is occasionally called WABT or simply EIT. Therefore, when talking about the reactor-bed temperature, the speaker should clarify its definition.
For its catalyst-monitoring program, Syncrude has used the 2/3 EIT as well as several other methods (1/2 EIT, 3-point EIT, and 4-point EIT), depending on the hydrotreating unit and process licensors. Syncrude is currently switching to using the kinetic EIT.
Sample calculations
In Fig. 1, sample calculations were performed for each case to determine the average reactor temperature using various methods: ABT, WABT, 2/3 EIT, and kinetic EIT. Table 1a shows detailed calculations for Case 1.
Referring to Table 1a:
Column A is the thermocouple (TI; temperature indicator) location.
Column B is the catalyst weight fraction that represents TI readouts as shown in Column C.
The calculations assume that the catalyst weight (or volume) is equally shared with the neighboring TIs. The sum of each fraction must be unity as shown in Row 17. Case 1 in Fig. 1 is the plot of Column A vs. Column C. Rows 18 and 20 are ABT and 2/3 EIT, respectively. The cell formulas are also shown.
Column D is catalyst weight fraction (Column B) multiplied by temperature (Column C). The sum of Rows 4 to 16 is WABT, as shown on Row 19.
To obtain the kinetic EIT, three activation energies (Row 1) or E/R (Row 2) were assumed as follows:
(a) E/R = 12,600 K. (or E = 25,000 cal/mole; R = 1.987 cal/mole/K.). This is the typical value for nitrogen removal from coker gas oil that was obtained from pilot plant tests at Syncrude Research.
(b) E/R = 6,300 K.: assume half of (a).
(c) E/R = 25,200 K.: assume twice of (a).
Columns E, F, and G are fractional kinetic parameters for each E/R (Row 2). Row 17 shows the formula. The kinetic EIT (Row 21) can be obtained by the equation given in the definition box or in Row 21, using the sum of Rows 4 to 16.
Table 1b summarizes the results for all three cases. It is evident that the average reactor temperature varies largely, depending on the inside bed-temperature profiles and activation energies applied.
From the results in Table 1, further observations are made as follows:
- The 2/3 EIT is the same (367° C.) for all cases, regardless of the reactor inside temperature profiles, because it is determined using the reactor inlet and outlet temperatures only.
- The WABT and ABT are not the same because the intervals of TI location are different. They vary significantly depending on the temperature profiles in the bed.
- The kinetic EIT also differs significantly depending on the temperature profiles and the values of activation energy (or E/R) used. Knowing the temperature profiles and use of reasonable E/R is essential.
The activation energy can be obtained from pilot plant tests. In Syncrude hydrotreaters, nitrogen removal (HDN) is more important than sulfur removal (HDS); therefore, the E/R for HDN is used except for the diolefin reactor of the naphtha hydrotreater.
For the diolefin reactor, diolefin saturation is most important; and therefore, the activation energy for diolefin removal rather than HDN must be used. The E/R values for the naphtha hydrotreating are given elsewhere (OGJ, Sept. 6, 1999, p. 64).
Commercial data
Typical historical catalyst activity data from Syncrude's commercial hydrotreating units for naphtha and HGO have been reviewed applying the kinetic EIT.
Syncrude has two identical naphtha and two identical HGO hydrotreating units. Each naphtha unit has three consecutive reactor vessels, a diolefin reactor and two main reactors.
Each HGO unit has two consecutive vessels (guard and main). The guard reactor consists of only one bed (Bed 1); the main reactor has three beds (Bed 2, Bed 3, and Bed 4).
Catalyst activity as it pertains to HDN is monitored during the runs. The calculated reactor EIT is plotted as a function of days on stream or catalyst life (barrels of feed processed per pound of catalyst loaded). Figs. 2 and 3 show typical daily activity data based on HDN.
Fig. 2 shows the EIT results on the naphtha hydrotreating unit (two main reactor vessels) excluding the diolefin reactor. The figure reflects the following:
- The kinetic EIT of each reactor vessel was obtained by the method described in the previous section using all TI readouts and the E/R (12,300 K) for HDN of naphtha (OGJ, Sept. 6, 1999, p. 66). The EIT of the combined two main reactors was calculated using the kinetic EIT and catalyst weight fraction of each reactor.
- The modified EIT was obtained by a combination of three and four-point EITs for each reactor.
- The actual kinetic and modified EITs so obtained were normalized at a constant feed rate, H2 partial pressure, and % HDN, assuming first-order HDN kinetics and a power term of H2 partial pressure.
- There is a step change of EIT at about 35 bbl/lb. This is due to an abnormality in the operation at this point.
- Best-fit straight lines were obtained for each group of the data.
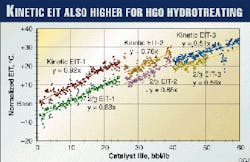
Fig. 3 shows the EIT results on the HGO hydrotreating unit for all beds including the guard reactor. The figure reflects the following:
- The kinetic EITs of each bed and overall reactors were obtained in the same way as for the naphtha hydrotreater, using a value of 12,600 K. for E/R.
- The 2/3 EIT of the overall reactor was obtained by adding catalyst weight fraction and 2/3 EIT of each bed.
- The actual EITs so obtained were also normalized in a similar way as for the naphtha hydrotreater, assuming the first-order HDN kinetics and power term of H2 partial pressure.
- There are step changes of EIT at about 25 bbl/lb and 40 bbl/lb. The catalysts in the guard reactor were replaced at these points.
- Best-fit straight lines were obtained for each group of the data.
In Figs. 2 and 3, the EIT at start-of-run (zero catalyst life) represents initial catalyst activity; the slopes of the straight lines represent the deactivation rate °C./bbl/lb.
Compared to the kinetic EIT, modified EIT for naphtha and 2/3 EIT for HGO give respectively about 39° C. and 8° C. lower start-of-run EIT (higher initial activity) and a different slope (deactivation rate).
An earlier pilot study showed that the commercial reactor temperature based on kinetic EIT is much closer to the isothermal pilot plant temperature.
In reactors where the shape of the temperature profile changes depending on feed quality and or operating conditions, the kinetic EIT method will provide a better estimate of the average reactor temperature than any of the other methods discussed above.
In the Syncrude naphtha hydrotreater reactors, the liquid vaporizes as it flows through the reactor; hence the temperature profile varies, depending on the reactor-inlet temperature. The monitoring of catalyst activity can be influenced by the technique used to calculate EIT: Different techniques produce different answers.
Syncrude has decided that kinetic EIT should be used for catalyst monitoring, because it provides a more accurate projection of remaining life.
Acknowledgments
The authors are grateful to Joe Kociscin at Exxon Mobil Corp. and Murray Gray at the University of Alberta for their support and valuable comments on this work and to Syncrude Canada Ltd. for its permission to publish it.
The Authors
Sok Yui is a research associate at the Edmonton Research Centre of Syncrude Canada Ltd. His research involves quality improvement of the products from oil sands bitumen, including hydrotreating, hydrocracking, aromatics hydrogenation, and catalyst evaluation. Prior to joining Syncrude in 1979, he was section head of manufacturing coordination and planning at Mobil Sekiyu and its refining company, Kyokuto Petroleum Industries in Tokyo. Yui holds BS, MS, and DEng degrees from the University of Tokyo, all in chemical engineering.
Peter Hubbard is a senior process engineering associate at Syncrude Canada Ltd. He is responsible for providing long-term technical direction for hydrotreating operations. He has 24 years of experience with Syncrude's upgrader. Prior to joining Syncrude, he was a process engineer for Imperial Oil. Hubbard holds a bachelors degree in chemical engineering from Queen's University, Kingston, Ont.


