NMR logs find reserves by-passed by conventional analysis
Nuclear magnetic resonance (NMR) technology is proving to be an essential tool for evaluating formations, especially low-resistivity reservoirs.
By differentiating between movable and immovable fluids, NMR logs have helped log analysts obtain more accurate reserve estimates than possible from conventional resistivity log interpretation, as shown by four examples in this article.
In these examples, NMR data aided in identifying a zone's producibility, determining lithology independent porosity, and distinguishing between bound and free water.
NMR data interpretation, however, requires caution and experience to ensure that suitable cutoff values are selected and that reliable conclusions are reached from the measured and calculated parameters, especially in carbonate reservoirs.
Along with identifying low-resistivity and low-resistivity-contrast reservoirs, NMR logs can also provide:
- Detailed porosity information, and thus, replace conventional porosity logs as the porosity and fluid type identifier.
- Accurate formation permeability, especially in complex lithology formations.
- Quantitative information about pore fluids such as clay-bound water, capillary-bound water, free water, oil, and gas.
- Predictions concerning water-free oil production, in cases where the resistivity log indicates high water saturation.
Low-resistivity reservoirs
A combination of conventional logs such as density, neutron, and resistivity logs is effective for evaluating normal reservoirs.
For low-resistivity reservoirs, however, an accurate determination of the petrophysical parameters with conventional logs is very difficult. The interpretation could indicate a high water saturation zone, even if water-free hydrocarbons would be produced. For these reservoirs, therefore, NMR logging has proven cost-effective for determining reservoir petrophysical properties.
In low-resistivity-contrast reservoirs, the water-hydrocarbon contact is difficult to locate from conventional log data, but NMRs can provide supplemental data to indicate the reservoir's producibility.
The main limitation of NMR, however, has been the cost and time of acquiring data.
Several different techniques have been used to analyze NMR data, as follows:
- T1/T2 ratio for fluid identification.
- Difference between NMR-derived porosity and total porosity to determine the types of clay minerals contained in the reservoir.
- NMR relaxation properties to identify a fluid's nature and rock properties.
For reservoirs with slight resistivity contrast between the water bearing and oil bearing formations, NMR can be used to identify the fluid's nature and then the height of the oil column. This analysis is based mainly on the high contrast of NMR relaxation parameters.
Formation evaluation
For formation evaluation, resistivity logs are the main pay-zone identifiers because of the resistivity contrast between oil and water zones. If a pay zone exhibits low resistivity, however, these logs become incapable of identifying producing zones or indicating water mobility. Many potentially productive zones with high irreducible water saturation can be overlooked because of this limitation.
Low-resistivity pay zones have a variety of causes. In these zones, even if resistivity data indicate high water saturation, oil or even water-free oil will be produced.
The reasons for the low-resistivity phenomenon can be classified primarily into two groups, as follows:
- Reservoirs where the actual water saturation can be high, but water-free hydrocarbons are produced. Micro porosity is usually responsible for the high water saturation.
- Reservoirs where the calculated water saturation is higher than the true water saturation. This high water saturation is caused by the presence of conductive minerals such as clay minerals, metal sulfides, graphite, and pyrite in clean reservoir rock.
Pyrite is a common heavy mineral associated with marine sedimentary rocks. It has a good electrical conductivity that is usually comparable to, or even higher than, the conductivity of the formation water. Pyrite crystals may form a continuous network even at low pyrite concentrations.
Measured resistivity on dry pyrite ranges from 0.03 to 0.8 ohm-m. Pyrite's conductivity is of a metallic (electronic) nature and consequently any transfer of current between water and pyrites is based on conversion from ionic to electronic conductivity and vice versa. This leads to polarization at the water-pyrite interfaces, with a corresponding frequency dependent electrical properties.
Thus, the electrical properties of porous rocks with pyrites strongly depend on the amount and distribution of pyrite and the measuring frequency of the electrical current.1
The inability to determine the presence of hydrocarbons is usually not the problem with low-resistivity reservoirs. Generally, standard log analysis will identify hydrocarbon-bearing zones. The problem is to predict that little or no water will be produced, even though log analyses indicate that the formation has a high water saturation.
NMR logging is a promising candidate for solving this problem. Such logs can identify water-free production zones, correlate bound-fluid volume with clay mineral inclusions in the reservoir, and identify hydrocarbon type.2
The connection between NMR measurements and petrophysical parameters stems from the strong effect that the rock surface has on promoting magnetic decay of saturating fluids. The longitudinal relaxation time (T1) is an important parameter for estimating petrophysical properties, but the NMR only measures the transverse relaxation time (T2) which is influenced by the inclusion of paramagnetic minerals such as (iron-bearing) chlorite in low-resistivity pay zones.
La Torraca determined that a magnetic gradient exits between pore fluids and iron-bearing rock minerals.3 These gradients will influence the diffusion of oil and water out of the frequency domain, resulting in faster T2 decay. This faster decay will result in underestimating effective porosity and lead to difficulties in the determining bound and free fluids.
The phenomenon of low-resistivity-contrast pay zones is encountered in reservoirs where there is little resistivity difference between water bearing and oil-bearing zones.
In these reservoirs, the water-bearing zone contains relatively fresh water. The resistivity is, therefore, higher than normal. In the oil-bearing zone, the associated water is a mix of fresh and salt water, so that the resistivity is lower than normal and variable.
Such oil reservoirs also show a high level of connate water saturation that further depresses formation resistivity.
These two abnormal features make identification of a pay zone from a resistivity log difficult. NMR logs have clearly solved this problem because in low-resistivity-contrast reservoirs, the NMR shows high-contrast relaxation times.4
NMR Logs
NMR technology can help identify movable fluids, quantify irreducible water saturation, determine effective porosity, and determine the bound fluid volume.
NMR measurements also provide better estimates of formation permeability than can be derived from conventional logs. Furthermore, in virgin zones, NMR measurements alone can determine an accurate formation water saturation.
NMR porosity
NMR measurements are more capable than conventional logs of providing clay-corrected porosity, both nonproductive and productive porosity. This is because NMR measurements are sensitive to hydrogen nuclei in fluids, while neutron-density logs are sensitive to hydrogen in the formation as well as in fluids.
The strength of the NMR signal is proportional to the number of hydrogen atoms in the NMR tool-dependent rock volume.
In zones containing light hydrocarbon, where the hydrogen index is less than one, NMR porosity will typically underestimate true porosity in proportion to the hydrogen index. In these formations there is a separation between density and neutron porosity, which indicates light hydrocarbon. For oil and water, NMR results can be expressed as the percentage of fluid volume per rock volume.
The number of hydrogen atoms in gas depends strongly on temperature and pressure. Hence, in natural gas reservoirs, accurate estimates of pressure and temperature are required to account for their effects.5-8
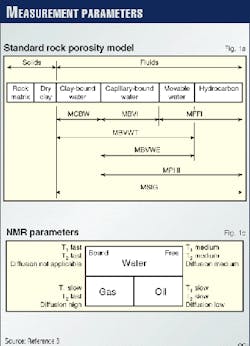
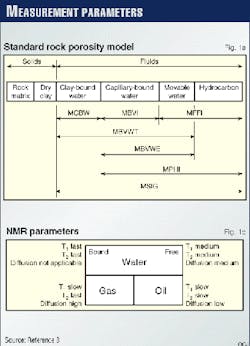
In some literature, there has been some confusion in defining and using the results of NMR porosity data. To clarify this confusion, Fig. 1a shows the standard rock porosity model, as follows:
- MSIG denotes total porosity.
- MPHI is the effective porosity from NMR (fluid fractions of the rock except for clay bound fluids, all porosity with T2 greater than 3 ms).
- MCBW represents the clay-bound-water porosity with T2 less than 3 ms.
- MFFI, the free fluid index, includes all movable fluids (hydrocarbon and free water) with T2 more than 33 ms for sandstone.
- MBVI, the capillary bound water, is defined as all porosity measured with T2 between 3 and 33 ms.
- MBVWT represents all bulk-volume water (free, capillary, and clay bound water).
NMR permeability
NMR technology has led to the development of new permeability models. NMR's ability to distinguish between bound and free fluids improves estimates of formation permeability.
In sandstone formations, NMR is characterized as a permeability estimator. But in carbonate formations, the match between core permeability and NMR-derived permeability can vary considerably.
The three porosities, previously mentioned, are used in Coate's equation to obtain formation permeability k, as follows:
k = [MPHI/C ]4 [MFFI/MBVI ]2 (1)
C is a term that reflects the correlation between the rock's pore throat and pore size. Other expressions for formation permeability are also available. One of these expressions uses the logarithmic average of the T2 distribution, as follows:10
k = ksdr = C x T2m2 x TCMR4 (2)
In this equation, ksdr = NMR permeability; C = multiplier which is 4 in sandstone and varies from 0.4 to 0.04, (nominally 0.43) in carbonates; T2m = logarithmic mean of T2 distribution; and TCMR = total CMR (combinable magnetic resonance) porosity.
From Equation 2, one can see that permeability in carbonates is reduced roughly ten times compared to permeability in sandstones. Also, the presence of vugs, fractures, and stylolites will add more complications.
In SDR (secondary delta-rho) measurements, T2 cutoff values are fixed at about 33 ms for sandstone and at about 100 ms for carbonates.
NMR fluid identification
New methods for acquiring and processing NMR log data enable signals from gas, oil, and water to be unambiguously separated and, in many cases, quantified. These methods exploit the combined effects of T1 and diffusion-based contrast on log response.
The T1 contrast separates the water and light hydrocarbons (oil and gas). Gas and oil signals are then separated based on the large contrast in the diffusion-induced T2 relaxation times for gas vs. liquid.
Fig. 1b shows, in a qualitative way, NMR properties for water, oil, and gas under typical reservoir conditions. Laboratory NMR data show that both T1 and T2 vary over several orders of magnitude depending on fluid type. Hence, to allow reliable fluid typing, linear gradient field NMR tools have to be capable of measuring relaxation times from less than 1 ms to several seconds.8-10
Freedman has introduced a new method called density-magnetic resonance (DMR) for evaluating gas-bearing reservoirs.11 The method combines total porosity from the NMR tool (TCMR) and density derived porosity (DPHI). The method provides gas-corrected total formation porosity and flushed-zone gas saturation.
Gas-corrected total porosity also improves permeability estimates made with the Coates-Timur equation in gas-bearing formations.
Low-resistivity reservoirs with a water saturation greater than 50% produce water-free hydrocarbon usually because of clay inclusions. Generally standard log analysis will identify these reservoirs. But, the problem is how to predict if little or no water will be produced.
A technique to solve this problem is based on the comparison between irreducible water saturation (Swi) derived from laboratory NMR surface area and water saturation (Sw) deduced from conventional log analysis.12
If Sw is less than or equal to Swi, free-water hydrocarbon will be produced; and if Sw is greater than Swi, water will be produced.
Field examples
As oil exploration moves into new areas, new problems are encountered, such as with well log interpretation. The following field examples show how NMR logs can help solve some of these problems.
Gulf of Mexico
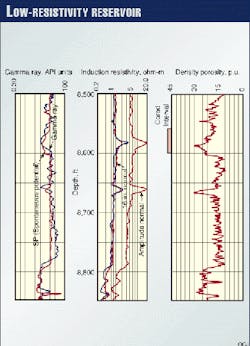
Fig. 2 shows a suite of logs from a Gulf of Mexico well drilled in a low-resistivity Pleistocene sandstone formation. Water saturation calculated from induction resistivity logs and using resistivity exponents measured on 12 core samples have shown that water saturation is generally greater than 50%. Water saturation values range from 25 to 74%.
Fig. 3a shows water saturation from the induction log as a function of surface area and density porosity. The core analysis indicates that these oil sands are not clean but contain silt-sized clay inclusions.
The samples consist of 14-34 wt % of less than 30 µ:m material. These clays present a high surface area on which water adheres, and the water, which is only several molecular layers thick on the surfaces, is bound and cannot move. The induction log responds to the total water (free and bound). Therefore, water saturation exceeds 50% but water-free hydrocarbons are produced.
Capillary analyses of these dirty cores have shown high irreducible water saturation. The source of the high capillarity is the existence of large to moderate surface area clay minerals. Capillary attraction holds water to the grain surface, and, hence, the actual water can be high, but oil without water is produced.
The main problem is to predict if little or no water will be produced, even though log analyses indicate a high water saturation. NMR measurements on sidewall core samples are the most readily available analysis technique. The procedure was as follows:
- NMR surface area measurements were conducted on the 12 core samples.
- Specific surface areas using equation (As = ANMR[ (1-phi)/phi]rhoma) were calculated, where phi = porosity and rhoma = matrix density.
- Swi from capillary pressure curves were plotted ( Fig. 3b). The correlation equation between Swi and As for each sample (correlation equation is Swi = 1 - e (- 0.0047As+0.24), rho = 0.982).
- Water saturation (Sw) from induction log and density log data were found.
- After comparing Sw and Swi, it was determined that water-free hydrocarbon will be produced over the interval where Sw is less than or equal to Swi. Water will be produced when Sw is greater than Swi.
Figs. 3a and b, when compared, show that Sw is generally less than Swi. This indicates that this section will produce water-free hydrocarbon. This was confirmed when the well was tested and showed water-free oil production.
If downhole NMR measurements are unavailable, a laboratory approach can be used, as follows:
- Start with Steps 1 and 2.
- Use the correlation equation in Step 3.
- Proceed with Steps 4 and 5 for the selected core samples.
North Sea
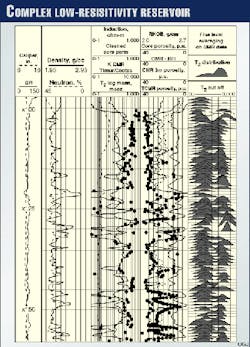
Fig. 4 shows an integrated well log from a North Sea well in a low-resistivity Jurassic sandstone formation. Induction log readings are a maximum of 3 ohm-m in the hydrocarbon-bearing zone and a minimum of 0.4. ohm-m. in the water zone.
Induction log analyses show that water saturation is greater than 50%. This water is immobile water, so that water-free oil is produced.
The core analyses showed that these sandstones are fine to very fine grained, very glauconitic, and micaceous. This complex lithologic nature reduces the effective porosity with significant reduction of water mobility.
Resistivity logs respond to total water (free and bound). Only NMR logs can distinguish between mobile and immobile fluids.
In this well, a full logging program was carried out that included an induction log, CMR log, NGS (natural gamma-ray, spectrometry log), and LDL-CNL (lito-density, compensated neutron logs).
Track 4 includes core porosity and NMR porosity. TCMR porosity is split into FFI (T2 more than 33 ms), clay-bound water MBVI (T2 less than 3 ms), and capillary-bound water CBVI (T2 between 3 and 33 ms).
Track 3 contains NMR permeability and core permeability. NMR permeability is calculated using Equation 2.
Track 5 provides the T2 distribution from 0.3 to 3,000 ms.
Track 2 includes the LDL-CNL log. This log shows positive separation against the hydrocarbon-bearing zone at X103. It is evident that effective CMR porosity with a lower T2 sensitivity limit of 3 ms underestimates the total porosity in a number of hydrocarbon producing sections, (see Track 3 interval X103-X114). This porosity deficit can be recovered by processing the total CMR porosity with a lower T2 sensitivity limit of 0.3 ms.
Egypt
Fig. 5 presents logging data for a gas well drilled in the Western Desert of Egypt. The main producing formation in this well is the Middle Cretaceous Kharita formation. Kharita is a shaly sand formation.13
This glauconitic sandstone is very heterogeneous and contains a mixture of silt, very fine sands, and glauconite. This complex lithology formation is characterized by high grained surface area, thus its irreducible water saturation is high.
Resistivity logs read about 1 ohm-m against pay zones and the log analyses have shown high water saturation (80%-90%). The wells produce water-free hydrocarbon, however, primarily because of micoporosity and high capillarity.
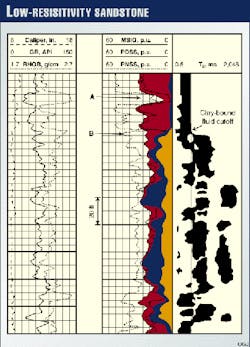
NMR data (Fig. 5) indicate a considerable amount of free fluids (gas and water) below Depth B, and little free fluid above Depth B (Track 2), based on the cutoff value of 33 ms (Track 3).
The true porosity is derived from a density log, other than NMR and neutron logs. At Depth A all porosity logs, MSIG, PNSS (porosity nuetron sandstone), and PDSS (porosity density sandstone) are about 10 p.u. (porosity units) while the true porosity is about 25 p.u. The is common in wells in the Western Desert fields; therefore, new wells in this area should be logged with NMR tools.
Saudi Arabia
A Saudi Arabian early Cretaceous, low-resistivity-contrast sandstone reservoir shows that the water-bearing formations contain relatively freshwater and thus have high-resistivity readings. But the pay zones contain a mixed water (brine and fresh) that makes the resistivity variable and lower than normal. This example shows the ability of NMR logs to identify oil zones bypassed by resistivity log analyses and considered as water zones.
These sandstone reservoirs are characterized by a high level of irreducible water saturation that causes a depressed resistivity. The relatively high water-zone resistivity and low pay resistivity created a low resistivity contrast between the pay zone and water zone, making pay zone identification from resistivity logs very tedious.
In a logging suite run in an oil producing well from a low-resistivity-contrast well, the gamma ray showed three sand bodies, and the resistivity ranged from 3 to 4 ohm-m, typical for a water-bearing zone in central Saudi Arabia fields. Because this well is producing hydrocarbon with little water, NMR logs can be used to determine the problem with the resistivity interpretation.
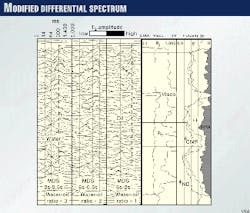
The NMR logging technique in the low-resistivity-contrast reservoirs is based on the contrast in the relaxation parameters (T1, T2, and diffusion) between water (free and bound) and hydrocarbon (oil and gas), as shown in Fig. 1b. The modified differential spectrum (MDS) technique was used to isolate the water signal from the hydrocarbon signal. This modified model uses three passes for three waiting time groups.
The MDS technique overcomes the NMR interpretation problem because of the absence of a nearby water zone required to observe T2 distribution change between water zone and oil zone on the normal T2 distribution curve.
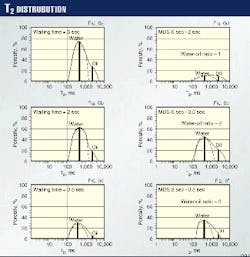
The illustrated model in Fig. 6 was developed for T1oil = 1 sec and T1 water = 2.5 sec. The model includes T2 distribution at 6, 2, and 0.5 sec waiting times (Figs. 6a-c) and three passes of MDSs with varying water-oil ratios (Figs. 6e-f).
The MDS technique shows a symmetrical spectrum around the peak at 300 ms in the case of water for all waiting times, which are shown by the broken curves in Fig. 6.
But in the case of oil and water, the model spectrum (solid curve) lost symmetry and shifted with respect to the ideal water peak in all waiting times. The oil peak was observed at 1,200 ms.
Track 6 (Fig. 8) shows the neutron-density and CMR porosity profiles. The three MDS passes (Tracks 1-3) identified the oil signal at 1,200 ms and water signal at 300 ms. The free-fluid index (FFI), shown in Track 6, illustrates that oil will be produced.
A formation tester, run after the log, confirmed oil in all three sand bodies.
References
- Clavier, C., Coates, G., and Dumanoir, J., "The Theoretical and Experimental Basis for The Dual Water Model for The Interpretation of Shaly Sand," The Log Analyst, JPT, Vol. 24, pp. 153-168, 1984.
- Hamada, G.M., and Al Awad, M.N.J., "Petrophysical Evaluation of Low Resistivity Sandstone Reservoirs," Paper No. SCA 9851, International Symposium of Core Analysts, The Hague, Sept. 14-16, 1998.
- La Torraca, G.A., Dunn, K.J., and Bergman, D.J.," MaSusceptibility Contrast Effects on NMR T2 Logging," SPWLA 36th Annual Logging Symposium, Paris, June 26-29, 1995.
- Hassoun, T.H., and Zainalabedin, K.," Hydrocarbon Detection in Low Contrast Resistivity Pay Zones, Capillary Pressure and ROS Determination with NMR Logging in Saudi Arabia," Paper No. SPE3770, 10th MEOS, Bahrain, Mar. 15-18, 1997.
- Akkurt, R., Vinegar, H.J., Tutunjian, P.N., and Guillorty, ''NMR Logging of Natural Gas Reservoir" The Log Analyst. Vol. 37, No. 6, pp. 33-42, 1996.
- Oraby, M, Habib, E., and Negm, E., "Experience in Permeability Calculation in the Obayied Field (Egypt) Using Magnetic Resonance Imaging," Paper No. SPE53277, 10th MEOS, Bahrain, Mar. 15-18, 1997.
- Ayan, C., Haq, S.A., and Boyd, A., "Integration of NMR, Wireline Tester, Core and Open Hole Log Data for Dynamic Reservoir Properties," Paper No. SPE53273, 10th MEOS, Bahrain, Mar. 15-18, 1997.
- Menger, S., and Prammer, M., "Can NMR Porosity Replace Conventional Porosity in Formation Evaluation," SPWLA 39th Annual Logging Symposium, Keystone, Colo., May 26-29, 1998.
- Timur, A., "Effective Porosity and Permeability of Sandstones Investigated Through Nuclear Magnetic Principles," The Log Analyst, Vol. 10, No. 1, pp. 3-11, 1969.
- Coates, G.R., Menger, S., and Miller, D., "Applying Total and Effective NMR Porosity to Formation Evaluation" Paper No. SPE38736, SPE Annual Technical Conference and Exhibition, 1997.
- Freedman, R., Chanh, C.M., Gubelin, G., Freeman, J.J., McGinnes, T, Terry, B. and Rawlence, D., "Combining NMR and Density Logs for Petrophysical Analysis in Gas Bearing Formations," SPWLA 39th Annual Logging Symposium, Keystone, Colo., May 26-29, 1998.
- Zemanek, J., "Low Resistivity Hydrocarbon Bearing Sand Reservoir" JPTFE, pp. 515-521, December 1989.
- Kenawy, F.A., " Exploitation of Abu Gharadig Field, Western Desert, Egypt" SPE Paper 18607, SPE International Meeting of Petroleum Engineering, Tianjin, Nov. 1-4, 1998.
The Authors
Gharib M. Hamada has been a professor of well logging and applied geophysics at Cairo University. He is currently with King Saud University. Previously, he was with the Technical University of Denmark, and Sultan Qaboos University, Oman. Hamada holds a BS and an MS in petroleum engineering from Cairo University and a DEA and a D"Ing in applied geophysics from Bordeaux University, France.
Mohamed S. Al-Blehed is an associate professor at King Saud University, Saudi Arabia. His interests are in petroleum economics, energy modeling, and reservoir evaluation. Al-Blehed holds a BS in petroleum engineering from Riyadh University and an MS and PhD in petroleum engineering from the University of Southern California.
Musaed N.J. Al-Awad is an associate professor at King Saud Unversity, Saudi Arabia. His interests are drilling engineering and petroleum-related rock mechanics. Al-Awad holds a BS and an MS in petroleum engineering from King Saud University and a PhD from Herriot-Watt University, U.K.
