Dan Lippe
Petral Consulting Co.
Houston
In the second article of this new series on midstream industry trends and developments (OGJ, Nov. 3, 2014, p. 82), discussion shifted from a 10-year review to an analysis of quarterly trends in US gas plant NGL production, domestic demand, and LPG exports. That second article also reviewed the expansion of the NGL raw-mix pipeline grid during 2009-13.
This article, the third in the series, extends analysis of quarterly trends in production, domestic demand, and exports through fourth-quarter 2014. It also underscores the importance of crude oil production trends as the key to trends in gas plant NGL production during the next 5 years.
While crude oil markets work off the current supply surplus, oil prices will remain too weak to support peak drilling levels in US shale plays, and US crude oil production will increase more slowly than during 2013-14. As crude oil production growth slows, associated natural gas (the most important source of NGL-rich gas) will also grow more slowly, as will growth in US gas plant NGL production.
The destiny of the US midstream industry is controlled by factors and forces outside its control. This observation bears repeating. While the midstream industry is an important and even critical element for the big picture of the US energy industry, the big picture industries (crude oil and natural gas production, petrochemicals and refining) will always determine trends in NGL supply, demand, and pricing.
As often happens during a boom in crude oil pricing, most analysts publish forecasts that call for $100/bbl oil pricing to be permanent in the economic environment. Petral Consulting, however, advised clients beginning in 2012 to expect a sharp decline in crude oil prices and forecast the downturn to occur sometime during 2014-16.
As growth in US crude oil production accelerated, Petral's long-term price forecasts moved the "date of no return" steadily forward. The two most important questions for future developments in US midstream now are:
1. When will crude oil prices recover and how quickly will US exploration companies resume drilling into the various crude prone shale plays?
2. How much will US crude oil supply increase before another supply surplus triggers another crude oil price collapse?
During the most recent 5-year period (2010-14), US midstream companies completed more projects and expanded capacity in all segments more than in any previous 5-year period in the past 50 years. The collapse in crude oil prices in fourth-quarter 2014 will reduce the rate of growth in crude oil production by 75% or more, most likely during second-half 2015. During this period of slow growth or no growth in NGL production, US midstream companies are unlikely to repeat their achievements in infrastructure expansions during 2010-14.
We now know, however, that crude oil resources in shale formations in North America are prolific and extensive. When crude oil prices jump 25-50% from levels of first-half 2015, US crude oil production will increase and will carry gas plant NGL production to new heights.
Midstream companies should begin to plan now for a second wave of NGL infrastructure projects sometime after 2018 or 2019.
NGL raw-mix production
Gas plant NGL production is the primary driver for most of midstream's infrastructure expansions. Crude oil and associated gas production has been the driver for growth in gas plant NGL production since 2011. Statistics from the US Energy Information Administration (EIA) show growth in US crude oil production reached 1.30 million b/d/year in fourth-quarter 2014 and production growth averaged 1.20 million b/d/year for second-half 2014.
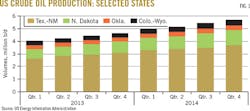
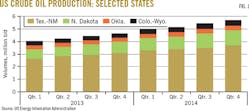
According to EIA statistics, crude oil production in six states-Texas, New Mexico, Oklahoma, North Dakota, Colorado, and Wyoming-increased by 978,600 b/d in second-half 2014 compared with 2013. Crude oil production growth in these six states accounted for 81.3% of annual growth in US crude oil in second-half 2014.
Table 1 and Fig. 1 summarize quarterly trends in US crude oil production.
Petral Consulting estimates associated gas production in the six core states was 11.5-13.0 bcfd in second-half 2014 compared with 10.5-11.5 bcfd in first-half 2014. Annual growth in associated gas production was about 2 bcfd in first half and second half 2014 compared with 2013. The growth in US crude oil production during second-quarter 2014 through first-quarter 2015 was 1.7 times more than annual growth in 2012. Growth in crude oil production in these six key states alone was 831,000 b/d in 2012 and increased to 962,000 b/d in 2014.
Regional trends
Year-to-year growth in gas plant NGL production reached its pinnacle in 2014. Furthermore, based on comparison of quarterly averages, US gas plant production achieved the most consistent levels of year-to-year growth in 2014. In first-half 2014, according to EIA statistics, gas plant NGL production increased by 339,400 b/d (13.6%) compared with first-half 2013 and was 2.83 million b/d. In second-half 2014, gas plant production increased by 375,500 b/d (13.8%) compared with second-half 2013 and was 3.09 million b/d. If all gas plants had operated in full ethane-recovery mode, US gas plant NGL production would have increased to 3.4-3.5 million b/d in late 2014 (Table 2).
Historically, when feedstock demand has fallen below gas plant supply for any sustained period (1 or 2 quarters), ethane inventory has increased to unsustainable levels and ethane prices have fallen to rejection levels. If ethane demand had kept pace with growth in gas plant ethane production, US gas plant NGL production would have been 130,000-140,000 b/d more than actual production in second-half 2012. Ethane supply growth, however, continued to exceed growth in ethylene feedstock demand during 2013-14 and ethane rejection increased to record high levels in fourth-quarter 2014.
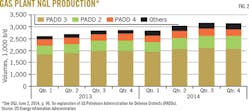
In third and fourth quarters 2014, gas plants in the US Gulf Coast (mainly Texas and New Mexico) remained important sources of growth in US gas plant NGL production, but gas plants on the East Coast and in the Midcontinent contributed almost equally in second-half 2014. Gulf Coast NGL raw-mix production increased by 123,800 b/d and accounted for about a third of growth in US production.
NGL production from gas plants in the Midcontinent surged in second-half 2014 when new gas plants in the Utica formation in eastern Ohio came on stream. Production increased by 120,100 b/d in second-half 2014, compared with 32,200 b/d in first-quarter 2014. Production growth in second-half 2014 accounted for 32.2% of total US production growth.
After years of publicity regarding the Marcellus's potential, NGL production from gas plants there continued to accelerate in second-half 2014. Growth rates for NGL production on the East Coast were 121,900 b/d/year in second-half 2014 compared with about 50,000 b/d/year in second-half 2013 (Fig. 2).
C2 rejection; raw-mix production
Spot prices in Mont Belvieu fell below levels that supported full ethane recovery in all western production regions in second-quarter 2012. As ethane prices continued to fall, recovery margins fell further below breakeven levels, and ethane rejection eventually spread to all producing regions.
Only gas plants that have committed ethane production to long-term "cost of service" supply contracts have ethane-recovery margins at breakeven or better. Gas plants in Ohio, Pennsylvania, and West Virginia and that signed supply contracts with Nova Chemical's plant at Corunna, Ont., fall into this category. Similarly, ethane-recovery margins were also marginally profitable for some gas plants in North Dakota but again only for ethane production that is committed to delivery to Nova Chemical's plants in Alberta with pricing determined by "cost of service."
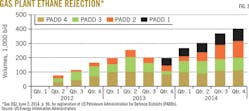
After second-quarter 2014, spot prices for purity ethane in Mont Belvieu declined by 12¢/gal and recovery margins fell further below breakeven. As a result, ethane rejection became increasingly widespread. In first-half 2014, ethane rejection reduced gas plant ethane supply by 250,000-300,000 b/d. If all gas plants had operated at full recovery, US gas plant ethane production would have increased to 1.29 million b/d in first-quarter 2014 and 1.39 million b/d in second-quarter 2014 (Fig. 3).
In second-half 2014, Petral Consulting estimates ethane rejection reduced gas plant NGL production by 350,000-400,000 b/d. If gas processors had operated all gas plants at full ethane recovery, US NGL production in fourth-quarter 2014 would have been 3.5 million b/d. Beginning in mid to late 2016, petrochemical companies will complete construction of several new ethylene plants. Enterprise Products Co. will also complete its ethane export terminal at Morgan's Point. During the following 2 years, ethane demand will increase by 300,000-500,000 b/d and most-perhaps all-US gas plants will be required to operate in full ethane recovery.
NGL market overview
Three markets account for more than 90% of US NGL demand:
1. Petrochemical feedstock.
2. Gasoline blending.
3. Retail space heating and internal combustion engine.
All five NGL components are used as feedstocks in petrochemical production, and normal butane, isobutane, and natural gasoline are used in gasoline blending. Retail space heating and internal combustion-engine markets, however, consume only propane. Of the three primary domestic end use markets, only the petrochemical industry has the potential to increase NGL consumption significantly in domestic markets. Construction of 12-15 billion lb/year of new ethylene capacity based on purity-ethane feedstock will drive NGL demand in the petrochemical industry.
The petrochemical industry is the largest of the midstream industry's three domestic end use markets. The ethylene feedstock market is the largest segment of the petrochemical industry in terms of NGL consumption. Petral Consulting estimates ethylene feedstock demand by direct contact with ethylene producers and based on production capacity for other industry segments. Other segments of the petrochemical industry include propane dehydrogenation (propane), methyl tertiary butyl ether (MTBE; normal butane and isobutane), and propylene oxide (isobutane).
NGL demand in the ethylene feedstock market was 1.49 million b/d in first-quarter 2014, but demand dipped to 1.43 million b/d in second-quarter 2014. Demand in first-half 2014 was 25,200 b/d less than in first-half 2013 and 84,400 b/d less than in second-half 2013.
In second-half 2014, ethylene industry NGL demand increased to 1.48 million b/d in third quarter and 1.51 million b/d in fourth quarter. Demand in second-half 2014 was 51,100 b/d less than in second-half 2013 but was 33,300 b/d more than in first-half 2014.
After 2 quarters of operating with almost no significant downtime for planned turnarounds or unplanned maintenance problems, ethylene producers played catch up, taking several plants out of service. Ethylene production fell to a low of 144.3 million lb/day in second-quarter 2014; production was 5.3 million lb/day (3.5%) less than in first-quarter 2014 and was 9.42 million lb/day (6.1%) less than in fourth-quarter 2013. After second-quarter 2014, ethylene production rebounded to 147.5 million lb/day in third-quarter 2014 and 149.9 million lb/day in fourth-quarter 2014.
Ethane accounted for 73.3% of ethylene industry NGL feedstock demand in first-quarter 2014 and 71.7% in second-quarter 2014. During first-half 2014, ethane demand set a new record high of 1.12-1.13 million b/d in January 2014 and averaged 1.085-1.095 million b/d for first-quarter 2014. In second-quarter 2014, ethane demand fell to a low of 1.005-1.015 million b/d (May) and averaged 1.025-1.035 million b/d.
Even though ethane maintained substantial cost advantages compared with all other feeds, its share of NGL feedstock demand dipped slightly and was 71.2% in third-quarter 2014. As crude oil began to fall in the fourth quarter, prices for all feeds declined, but prices for propane and normal butane fell more sharply than ethane. Furthermore, prices for major coproducts fell more slowly than feedstock prices, which contributed to further reductiion of ethylene production costs for all feedstocks but ethane. As a result, ethane lost its cost advantage compared with both propane and normal butane in November-December 2014. Ethane demand was steady at 1.051-1.06 million b/d in fourth-quarter 2014, but ethane's share of NGL feedstock demand fell to 70% in fourth-quarter 2014.
Historically, ethylene feedstock demand for propane varied as necessary to maintain a reasonable balance in the US propane market. The surge in propane exports from US Gulf Coast LPG export terminals has not changed the fundamental variability in ethylene feedstock demand, but feedstock demand has become much less important as a balancing mechanism since 2011.
In first-quarter 2014, ethylene industry feedstock demand for propane fell to an 8-quarter low and averaged 300,000-310,000 b/d. Demand in first-quarter 2014 was 119,000 b/d (28%) less than in first-quarter 2013. After demand in retail markets fell to typical offseason levels, ethylene feedstock demand for propane recovered to 330,000-340,000 b/d in June 2014.
Demand was steady within the range of 320,000-330,000 b/d in third-quarter 2014 and increased to 345,000-355,000 b/d in fourth-quarter 2014. Propane's share of NGL feedstock demand recovered to 22% in second and third quarters 2014 and 23.5% in fourth-quarter 2014 from 20.5% in first-quarter 2014 (Table 3).
Gasoline blending demand
The refining industry is the second largest industrial-commercial market for NGLs. Refineries buy normal butane, isobutane, and natural gasoline for use in gasoline blending. As is true for propane demand in retail markets, refinery demand for normal butane is strongly seasonal but demand for isobutane and natural gasoline is only moderately seasonal.
Refinery demand for normal butane reaches its seasonal peak during November through January, but refinery demand for isobutane and natural gasoline is usually at its seasonal peak in May through August. The counter-cyclical nature of refinery demand for isobutane and normal butane offsets some of the strongly seasonal demand for normal butane.
Motor gasoline production is the primary driver for refinery demand for butanes and natural gasoline. According to EIA's annual statistical summary, US refineries increased atmospheric tower capacity by about 1 million b/d during 2003-14, but EIA statistics show industry crude runs were almost flat during this period. US refineries, however, increased motor gasoline production by 1 million b/d during 2004-14 and accomplished this increase by boosting yields on crude runs and by increasing ethanol blending to nearly 900,000 b/d in 2014 from 320,000 b/d in 2006.
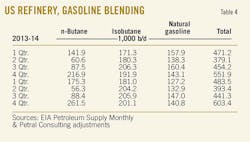
EIA statistics for refinery inputs show demand for butanes and natural gasoline was 393,400 b/d in second-quarter 2014. Refinery demand increased to 441,300 b/d in third-quarter 2014 and then to 603,400 b/d in fourth-quarter 2014.
According to EIA statistics, refinery inputs of gas plant normal butane were 56,300 b/d in second-quarter 2014 and were only 14.3% of total refinery demand. Demand for gas plant normal butane jumped to 261,500 b/d in fourth-quarter 2014 and accounted for 43% of total refinery demand for butanes and natural gasoline. Refinery input of normal butane in fourth-quarter 2014 was 205,200 b/d more than in second-quarter 2014 and 44,600 b/d (20.6%) more than in fourth-quarter 2013.
Refinery inputs of isobutane were almost constant during second through fourth quarters 2014. EIA statistics show refinery demand varied within a range of 200,000-206,000 b/d. Refinery isobutane demand in third-quarter 2014 was only 400 b/d less than in 2013 but demand in fourth-quarter 2014 was 9,200 b/d (4.8%) more than in fourth-quarter 2013.
Finally, EIA statistics show refinery natural gasoline inputs varied within a range of 125,000-150,000 b/d in 2014. Refinery natural gasoline demand has almost no distinct seasonality. Refineries use natural gasoline as a supplemental feed for pentane-hexane isomerization units. Some refineries have pentane-hexane isomerization units and some do not. As more refineries process increasing volumes of bitumen-diluent blend from northern Alberta's oil sands, the contained diluent will reduce refinery demand for natural gasoline in some refineries (Table 4).
Retail markets; NGL exports
Retail markets consume propane in four primary end use segments:
1. Residential, commercial, and resellers (space heating markets).
2. Agriculture.
3. Motor fuel.
4. Miscellaneous industrial.
Of these four segments, consumption in the residential-commercial sector typically accounts for 75-80% of total demand in the retail market. Petral estimates propane demand in all end use sectors increased to 700,000-710,000 b/d in fourth-quarter 2014 and 1 million b/d in first-quarter 2015. Petral also estimates retail propane demand in winter 2014 was 7 million bbl less than the 5-year average. Propane sales into retail markets always decline with warmer weather, and Petral estimates demand in second-quarter 2015 was 300,000-310,000 b/d.
Two factors converged to support continued growth in LPG exports during 2014. First, increasing supply surpluses resulted in persistent bearish pressures on spot prices in Mont Belvieu. Second, midstream companies continued to expand LPG export terminals. As was true in 2013, propane continued to receive high priority; butane exports lagged the surge in propane exports.
According to statistics published by US International Trade Commission, LPG export terminals in the Houston Ship Channel increased propane exports to 388,300 b/d in third-quarter 2014 and 455,500 b/d in fourth quarter. Propane exports from the channel increased to a new high of 493,600 b/d in December 2014. This record lasted one month. USITC statistics showed propane exports jumped to 610,500 b/d in February 2015. Channel propane exports were 90-91% of US propane exports in third and fourth quarters 2014.
Butane exports also increased during second-half 2014, but they remained less than 20% of propane exports. Butane exports were 62,000 b/d in third-quarter 2014 but slipped to 44,000 b/d in fourth-quarter 2014.
USITC statistics show propane exports to destinations in the Western Hemisphere were 211,400 b/d in third-quarter 2014 and accounted for 54.5% of total exports. Propane shipments to western hemisphere destinations increased to 258,900 b/d in fourth-quarter 2014 and were 56.8% of total exports. Exports to Europe in second-half 2014 varied within a range of 45,000-110,000 b/d and averaged 84,600 b/d in third-quarter 2014 and 89,000 b/d in fourth-quarter 2014.
Finally, the increase in terminal capacity also supported growth in exports to destinations in Northeast Asia. Exports to Asian destinations were 77,300 b/d in third-quarter 2014 and increased to 107,400 b/d in fourth-quarter 2014 (Table 5).
US ethane exports currently move exclusively to Canada. EIA statistics showed ethane exports were 20,000-25,000 b/d during first and second-quarter 2014 and increased to 47,100 b/d in third quarter and 60,700 b/d in fourth-quarter 2014. When Enterprise Products Co. completes its ethane export terminal in the Houston Ship Channel in 2016, US will begin to export ethane to ethylene producers in Europe, India, and Asia.
Raw-mix fractionation
In 2008-09, US gas processing companies faced the simultaneous constraints of insufficient capacity in existing raw-mix pipelines and merchant fractionation facilities. The US midstream industry geared up to increase simultaneously NGL raw-mix pipeline capacity and merchant NGL fractionation capacity. Most new fractionators were located in the Upper Texas Coast but existing facilities in the Midcontinent (primarily Conway/Bushton) were also expanded. Finally, rather than build multi-billion dollar raw-mix pipelines to the Gulf Coast, gas producers and midstream companies developed several new grassroots fractionators in the Marcellus/Utica shale plays in Ohio, Pennsylvania, and West Virginia and created a new self-contained market hub.
In 2007, according to company annual reports and websites, NGL fractionation capacity in Mont Belvieu, Tex., was 697,000 b/d and capacity in the Upper Texas Coast (Houston to Beaumont) was 879,000 b/d. Midstream companies developed 12 new raw-mix fractionation trains during 2010-14, and these projects increased merchant fractionation capacity by 932,000 b/d. Total capacity in operation at yearend 2014 was 1.81 million b/d. Additions to NGL fractionation capacity located in Mont Belvieu proper increased by 810,000 b/d.
In 2007, Enterprise Products operated 242,000 b/d of fractionation capacity. Enterprise completed its first fractionation project in 2010 and completed five new fractionation trains during 2010-14. Each train had a design capacity of 85,000 b/d and the combined capacity of all five new trains was 425,000 b/d. Enterprise Products Co. has one additional fractionation train under construction, and this unit is scheduled to come on stream before yearend 2015. By yearend 2015, Enterprise Products Co. will have 752,000 b/d of operational capacity at its facilities in Mont Belvieu. Enterprise Products' fractionation projects accounted for 45.6% of the overall increase in capacity during 2010-2014.
In 2007, Targa Resources operated 175,000 b/d of fractionation capacity in Mont Belvieu. Targa Resources completed a 75,000 b/d expansion in 2011 and a new fractionator with 100,000 b/d of capacity in 2013. Oneok Midstream operated 160,000 b/d of fractionation capacity in Mont Belvieu and added a new train with 75,000 b/d of capacity in 2013. Oneok has a second new train under construction with a capacity of 60,000 b/d. This unit is scheduled to be in service by yearend 2015 (OGJ Online, June 23, 2014). (An accompanying summary of US fractionation capacity growth may be found on p. 70)
Gulf Coast Fractionators, a partnership operated by Phillips 66, operated a unit with 120,000 b/d capacity in 2007. Gulf Coast Fractionators completed an incremental expansion that increased operating capacity to 145,000 b/d. Phillips 66 also has a new NGL fractionation project under construction at Sweeney, Tex. This unit has a design capacity of 100,000 b/d. Finally, Lone Star NGL LLC completed two fractionation projects (one in 2012 and the other in 2013) and each train has a design capacity of 100,000 b/d.
Various midstream companies developed almost 500,000 b/d of new and grassroots NGL fractionation plants in the Marcellus-Utica basin during 2010-14. Three projects accounted for the bulk of new grassroots capacity in Ohio, Pennsylvania, and West Virginia. MarkWest Energy developed 286,000 b/d of NGL raw-mix fractionation capacity at various locations in Pennsylvania. Utica East Ohio Midstream LLC (a partnership of three midstream companies) developed a fractionation plant in Harrison County, Ohio. This unit has a design capacity of 135,000 b/d.
Williams Ohio Valley Midstream expanded its plant in Marshall County, WV, during 2011-13 to a current design capacity of 42,500 b/d. Finally, Dominion Transmission Inc. constructed a fractionation train at its Hastings gas processing plant in Wetzel County, WV. This unit has a design capacity of 13,800 b/d. The combined capacity of these four projects and the unit at Siloam, Ky., is 501,300 b/d.
Price trends; profitability
Petral Consulting tracks gas processing economics based on netback values of NGL raw mix for gas plants in Texas, New Mexico, and the Rocky Mountains. Gas plants in these regions are the primary sources of NGL raw-mix deliveries to NGL fractionators in Mont Belvieu.
The increase in gas plant production of propane and butanes occurred during a period of limited growth in demand in domestic markets. The predictable result was growing supply surpluses. These surpluses, in turn, caused spot prices for propane and normal butane to weaken and resulted in the surge in LPG exports from Houston Ship Channel export terminals.
Furthermore, spot cargo freight rates for the international LPG vessel fleet surged in second-quarter 2014 and were double and triple prevailing freight rates in 2012-13. The spike in freight rates also contributed to depressed prices for propane and normal butane in Mont Belvieu for in second and third quarters 2014.
In September 2014, spot crude oil prices were $97/bbl for dated Brent and $93/bbl for WTI at Cushing, Okla. By the end of December, spot prices for dated Brent were $55-56/bbl and $53-55/bbl for WTI at Cushing. The collapse in crude oil prices outweighed all other influences on NGL prices including cold weather during December 2014 through March 2015.
Petral estimates the weight-averaged price of NGL raw mix in Mont Belvieu was 88¢/gal ($8.48/MMbtu) in third-quarter 2014. In late December, the weight-averaged price for NGL raw mix was 49¢/gal ($4.64/MMbtu).
Crude oil prices continued to fall in January but recovered in February-March to levels comparable with mid to late December. The weight-averaged pricing for NGL raw mix was almost unchanged in first-quarter 2015 compared with December 2014 (48¢/gal in first-quarter 2015 compared with 49¢/gal in mid to late December).
After 24 months of increasing US LPG exports, LPG freight rates in the international market tripled for LPG shipments from the Middle East to Japan and quadrupled for shipments from the Houston Ship Channel to Japan. The surge in freight rates for spot cargoes was one of the primary reasons for the decline in Petral's NGL raw-mix price index for Mont Belvieu during second-quarter 2014. The NGL raw-mix price index declined by 10.8¢/gal and averaged 91.9¢/gal ($8.83/MMbtu) for second-quarter 2014.
Gross margins for gas plants in West Texas were higher than $3.50/MMbtu in first-half 2014. Gross margins improved to $3.83/MMbtu in third-quarter 2014 but were $2/MMbtu in fourth-quarter 2014 and were $1.63/MMbtu in December 2014. Petral Consulting estimates gross margins averaged $1.06/MMbtu in first-quarter 2015 but recovered to $1.63/MMbtu in April 2015.
Outlook
The Baker Hughes rig count showed 1,574 rigs in crude oil-directed service in late November. As the decline in global benchmark prices accelerated after the meeting of the Organization of Petroleum Exporting Countries (OPEC) in late November last year, exploration and production companies slashed drilling in all major basins. According to the Baker Hughes's weekly updates, the rig count (rigs in crude oil service) fell by almost 50% during early December through the end of March.
Although crude oil production in the core NGL-producing states will probably continue to increase during first-half 2015 as the backlog of wells drilled but not completed is worked off, sometime in second-half 2015, the sharp decline in drilling activity will begin to curtail crude oil production growth.
Petral bases its long-term forecasts for gas plant NGL production on crude oil production growth of 200,000-300,000 b/d for 2016-17. Petral forecasts NGL production in the Gulf Coast, Midcontinent, and Rocky Mountains will increase by 75,000-125,000 b/d during second-half 2015 through first-half 2016. US LPG exports will continue to increase as additional export terminal capacity is placed in service.
Before yearend 2017, growth in crude oil demand will reduce the current supply surplus and crude oil prices will begin to rebound. US crude oil producers will increase drilling in conjunction with the rebound in prices and the next cycle will begin.
The author