GOM REVENUE SHARING-3 Forecast sheds light on GOMESA Phase II expected revenues
Mark J Kaiser
Center for Energy Studies
Louisiana State University
Baton Rouge
The second phase of Gulf of Mexico Energy Security Act of 2006 (GOMESA) revenue sharing will begin in 2017 and specifies that 37.5% of qualified revenues from Outer Continental Shelf (OCS) leases issued after Dec. 20, 2006, will be shared with gulf producing states, subject to an annual cap of $375 million.
OCS revenues from bonus bids, rent, and royalty are expected to average $1.6 billion/year over the next decade, bound between $400 million and $3.2 billion in annual revenue. GOMESA qualified revenues are expected to average $600 million/year with low-to-high estimates of $150 million/year to $1.2 billion/year.
In this final article of a three-part series we develop the aforementioned bounds on GOMESA Phase II revenues based on revenue models and a transparent set of assumptions.
In the previous two articles we described the regulatory basis for OCS leasing, examined the empirical relations governing acreage awarded, and introduced bonus, rent, and royalty data fundamental to this evaluation (OGJ, Mar. 2, 2015 p.66; OGJ Apr. 6, 2015, p. 66).
View Image Gallery>>
Qualified Revenues
We use five models to estimate qualified revenues from bonus bids, rent, and royalty across two time periods and lease inventories. The first period began in 2007 for leases awarded 2007-16 and the second starts in 2017 for leases awarded 2017-57. The specific models are:
1. Rent from leases awarded 2007-16 and active after 2016.
2. Royalty from leases awarded 2007-16 and producing after 2016.
3. Bonus bids from leases awarded 2017-57.
4. Rent from leases awarded 2017-57.
5. Royalty from leases awarded 2017-57.
Models 1 and 2 are called legacy models because they are based on lease inventories for 2014. Models 3, 4, and 5 are referred to as future models. Both model types require estimates of expected activity and apply different forecasting approaches.
GOMESA Phase II starts in 2017, but our forecast is based on data through 2014. Both 2015 and 2016 would be considered legacy years if we had those data. Because we don't, they are incorporated into the 2017-57 forecasts for now. This simplification does not materially impact the results.
View Image Gallery>>
Legacy, future models
Legacy leases awarded during 2007-14 will generate rents and, if successful, royalties on production. Gulf producing states will capture the revenues from these leases starting in 2017 if the leases are in primary term or producing.
2007-14 rent and royalty are known and can be used reliably to produce a forecast with standard model assumptions. Royalty on legacy leases from new wells drilled and produced is subject to the same degree of uncertainty as future models.
For leases awarded after 2017, Gulf producing states will capture bonus, rent, and royalty on production for all leases awarded through 2057.
Because leases available, bid on, and awarded in this timeframe are unknown, modeling qualified revenues is uncertain. Future bonus and rental payments are also uncertain.
The purpose in modeling these revenue components is to determine expected revenue bounds within reasonable ranges, not to forecast specific trajectories.
Exploration activity and the success of exploration is unknown, making future production royalty uncertain, as well.
Statistical models that capture historic variation and are suitably categorized are believed to be adequate to estimate revenue bounds.
View Image Gallery>>
Bonus-bid forecast
The sum of high bids in future lease sales is modeled with the expected acreage awarded and average bonus bids by water depth and planning area in the Central Gulf of Mexico (CGOM) and Western Gulf of Mexico (WGOM).
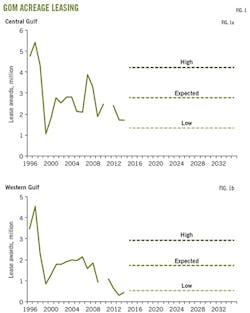
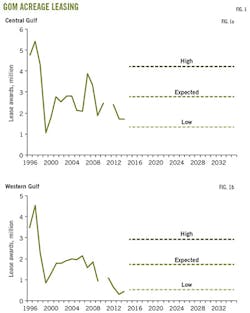
Expected acreage awarded is derived from 1996-2014 data and assumed to be bound by a one standard deviation interval (Table 1, Fig. 1).
Bonus bids in shallow water are forecast based on historic levels, and in deepwater, on oil price assumptions (Table 2).
In WGOM shallow water, the average 20-year bonus bid was $84/acre with a standard deviation of $34/acre. A reasonable expectation for future bid prices in the region is $50-$118/acre.
In the CGOM shallow water, the 20-year average bonus bid was $152/acre with a standard deviation of $54/acre. A reasonable expectation of future bid prices is $98-$206/acre.
In deepwater, the average bonus bid is assumed to be determined by oil prices from $60 to $100/bbl.
At $60/bbl, the average bonus bid is $168/acre in the deepwater WGOM and $337/acre in the deepwater CGOM. At $100/bbl, the average bonus bid is $232/acre in the deepwater WGOM and $691/acre in the deepwater CGOM.
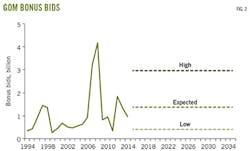
Income arising from bonus bids in the GOM during 2015-35 will average $1.22 billion/year, $221 million in shallow water and $1.01 billion in deepwater (Table 3, Fig. 2).
Bonus bids in any given year are expected to range from $69 to 456 million in shallow water and from $295 million to $2.21 billion in deepwater. More than two-thirds of total bonus bids in future lease sales are expected to arise from the CGOM.
View Image Gallery>>
Rent forecast
Future acreage awards are based on 1996-2014 data and assumed to be bound by one standard deviation. Rent payments from 2015-35 include the contribution from the lease inventory circa 2014 that extends through 2023 (legacy rent), as well as new leases expected to be awarded after 2014 (future rent).
Rent trajectories directly reflect the model assumptions. Rents increase through 2024 as the 2014 circa lease inventories expire. They subsequently remain flat as leases awarded after 2014 are assumed constant and bound by historic levels.
Rental payments in the GOM are expected to reach $400 million by 2024 with high-low boundaries of $180-$700 million (Fig. 3). Most of the rental payments arise from CGOM leases (Fig. 4), and deepwater is expected to generate about 80% of total rent (Table 4).
Royalty forecast
Royalty revenue on leases awarded 2007-14 and producing after 2016 depends on production from existing wells, future oil and gas prices, and additional successful exploration and development on the lease inventory.
Legacy royalty revenue from existing wells can be modeled with a reasonable degree of certainty because all producing wells for 2014 are known.
For leases awarded after 2014 and for new wells drilled on the 2014 lease inventory, royalty revenues depend on the number of producing wells that come online and the production profile of each well, both of which are unknown.
View Image Gallery>>
Royalty-model assumptions
The future number of producing wells is estimated based on the average number of wells that began production 2008-14 (Table 5).
In the expected drilling scenario, five gas wells and three oil wells are brought online every year in water less than 400 m deep. One gas well and two oil wells are brought online every year in water deeper than 400 m.
High and low projections for the number of producing wells are based on a one-standard-deviation interval in shallow water and the historic maximum and minimum number of wells in deepwater.
Drilling activity is assumed constant at scenario conditions for a 20-year future period.
Cumulative gas-oil ratios are used to classify wells as "primarily oil producing" or "primarily gas producing." For each well class in shallow and deepwater, type curves are constructed using all producing wells on leases issued after 2007 (Fig. 5).
The average shallow-water oil well had a peak production of 20,000 boe/month with an estimated ultimate recovery (EUR) of 1.8 million boe. The average deepwater oil well had peak production of 314,000 boe/month with an estimated EUR of 7.3 million boe. The average shallow water gas well had peak production of 345 MMcfe/month and an EUR of 14.2 Bcfe. The average deepwater gas well reached 1,511 MMcfe/month and had an EUR of 67.7 Bcfe.
The ability to reliably predict production trends from future leases is limited. The point of modeling, therefore, is to illustrate what would happen under assumed conditions, not as a description of what will transpire.
The expected scenario is based on historic data, but whether historic averages are a reliable predictor of future activity and performance is itself unknown.
View Image Gallery>>
If drilling could be reliably predicted and formations could be assumed to behave relatively similar to one another, type curves would provide a reasonable production estimate. But, again, this is not the case.
With these limitations in mind, production from the inventory of wells on leases awarded 2007-14 and for future drilling scenarios is expected to be 7-25 million bbl/year and 35-140 bcf/year by 2024 (Fig. 6).
If no new drilling activity occurs in the future, production from the 2014 inventory of wells is expected to follow the trajectory shown in Fig. 6 as "2014 inventory."
Royalty revenue by 2024 from oil is expected to be $100-320 million/year, and for gas $20-70 million/year (Fig. 7). Deepwater will contribute about two-thirds of production on a heat-equivalent basis and oil is responsible for about 80% of the total royalty revenue generated.
Royalty revenue is expected to be $20-160 million/year in water shallower than 400 m, and $90-240 million/year in water deeper than 400 m.
Royalty revenue from oil and gas in shallow and deepwater combined is expected to be $100-400 million/year with an expected value of $250 million/year (Fig. 8).
View Image Gallery>>
Qualified revenue bounds
OCS revenues derived from bonus bids, rent, and royalty range from about $400 million/year in the low scenario to $3.2 billion/year in the high scenario, and $1.6 billion/year in the expected scenario (Fig. 9).
GOMESA Phase II qualified revenues represent 37.5% of the combined total of OCS bonus bids, rent, and royalty. Summing the revenue components for each model yields an expected value of $600 million/year, bounded between a $150 million/year low and a $1.2 billion/year high (Fig. 10).
Bonus bids are the most significant short-term revenue component and will vary widely if historic trends are an indication of future behavior.
GOMESA Phase II revenues are determined from 37.5% OCS annual revenue or $375 million/year, whichever is smaller, and conservative assumptions predict the program cap will likely be met throughout its life.
The author


